
Revisiting Tracking Data under Bowness
Team Analytics, Offensive Contributions, Third Period Play, Goaltender Performance

The Blue Jackets have a perilously small sample under Rick Bowness and will continue to have one as they move into the critical decision period of the year. Given the stark declarations about the importance of the specific stretch of games from Zach Werenski and Don Waddell, and the incredible winning performance, you have to think the complexion of decisions has changed quite dramatically.
The best decisions aren’t made with these micro performance measures in mind but rather in concert with smoother, longer term plans. Unfortunately, it appears the Blue Jackets are past that specific point.
I say all of this just to give a bit of a warning and lay out the complexity of the situation before us. We have limited sample under the new coach and a ton of weight on decisions to be made based on projecting the entire team’s performance in this new context.
To put it directly, we have imperfect data on an imperfect sample and we’re going to commit some sample size crimes because we have no other choice. If you have flashing warning lights on your dashboard, you’re going to have to turn those off.
Team Analytics with HockeyViz
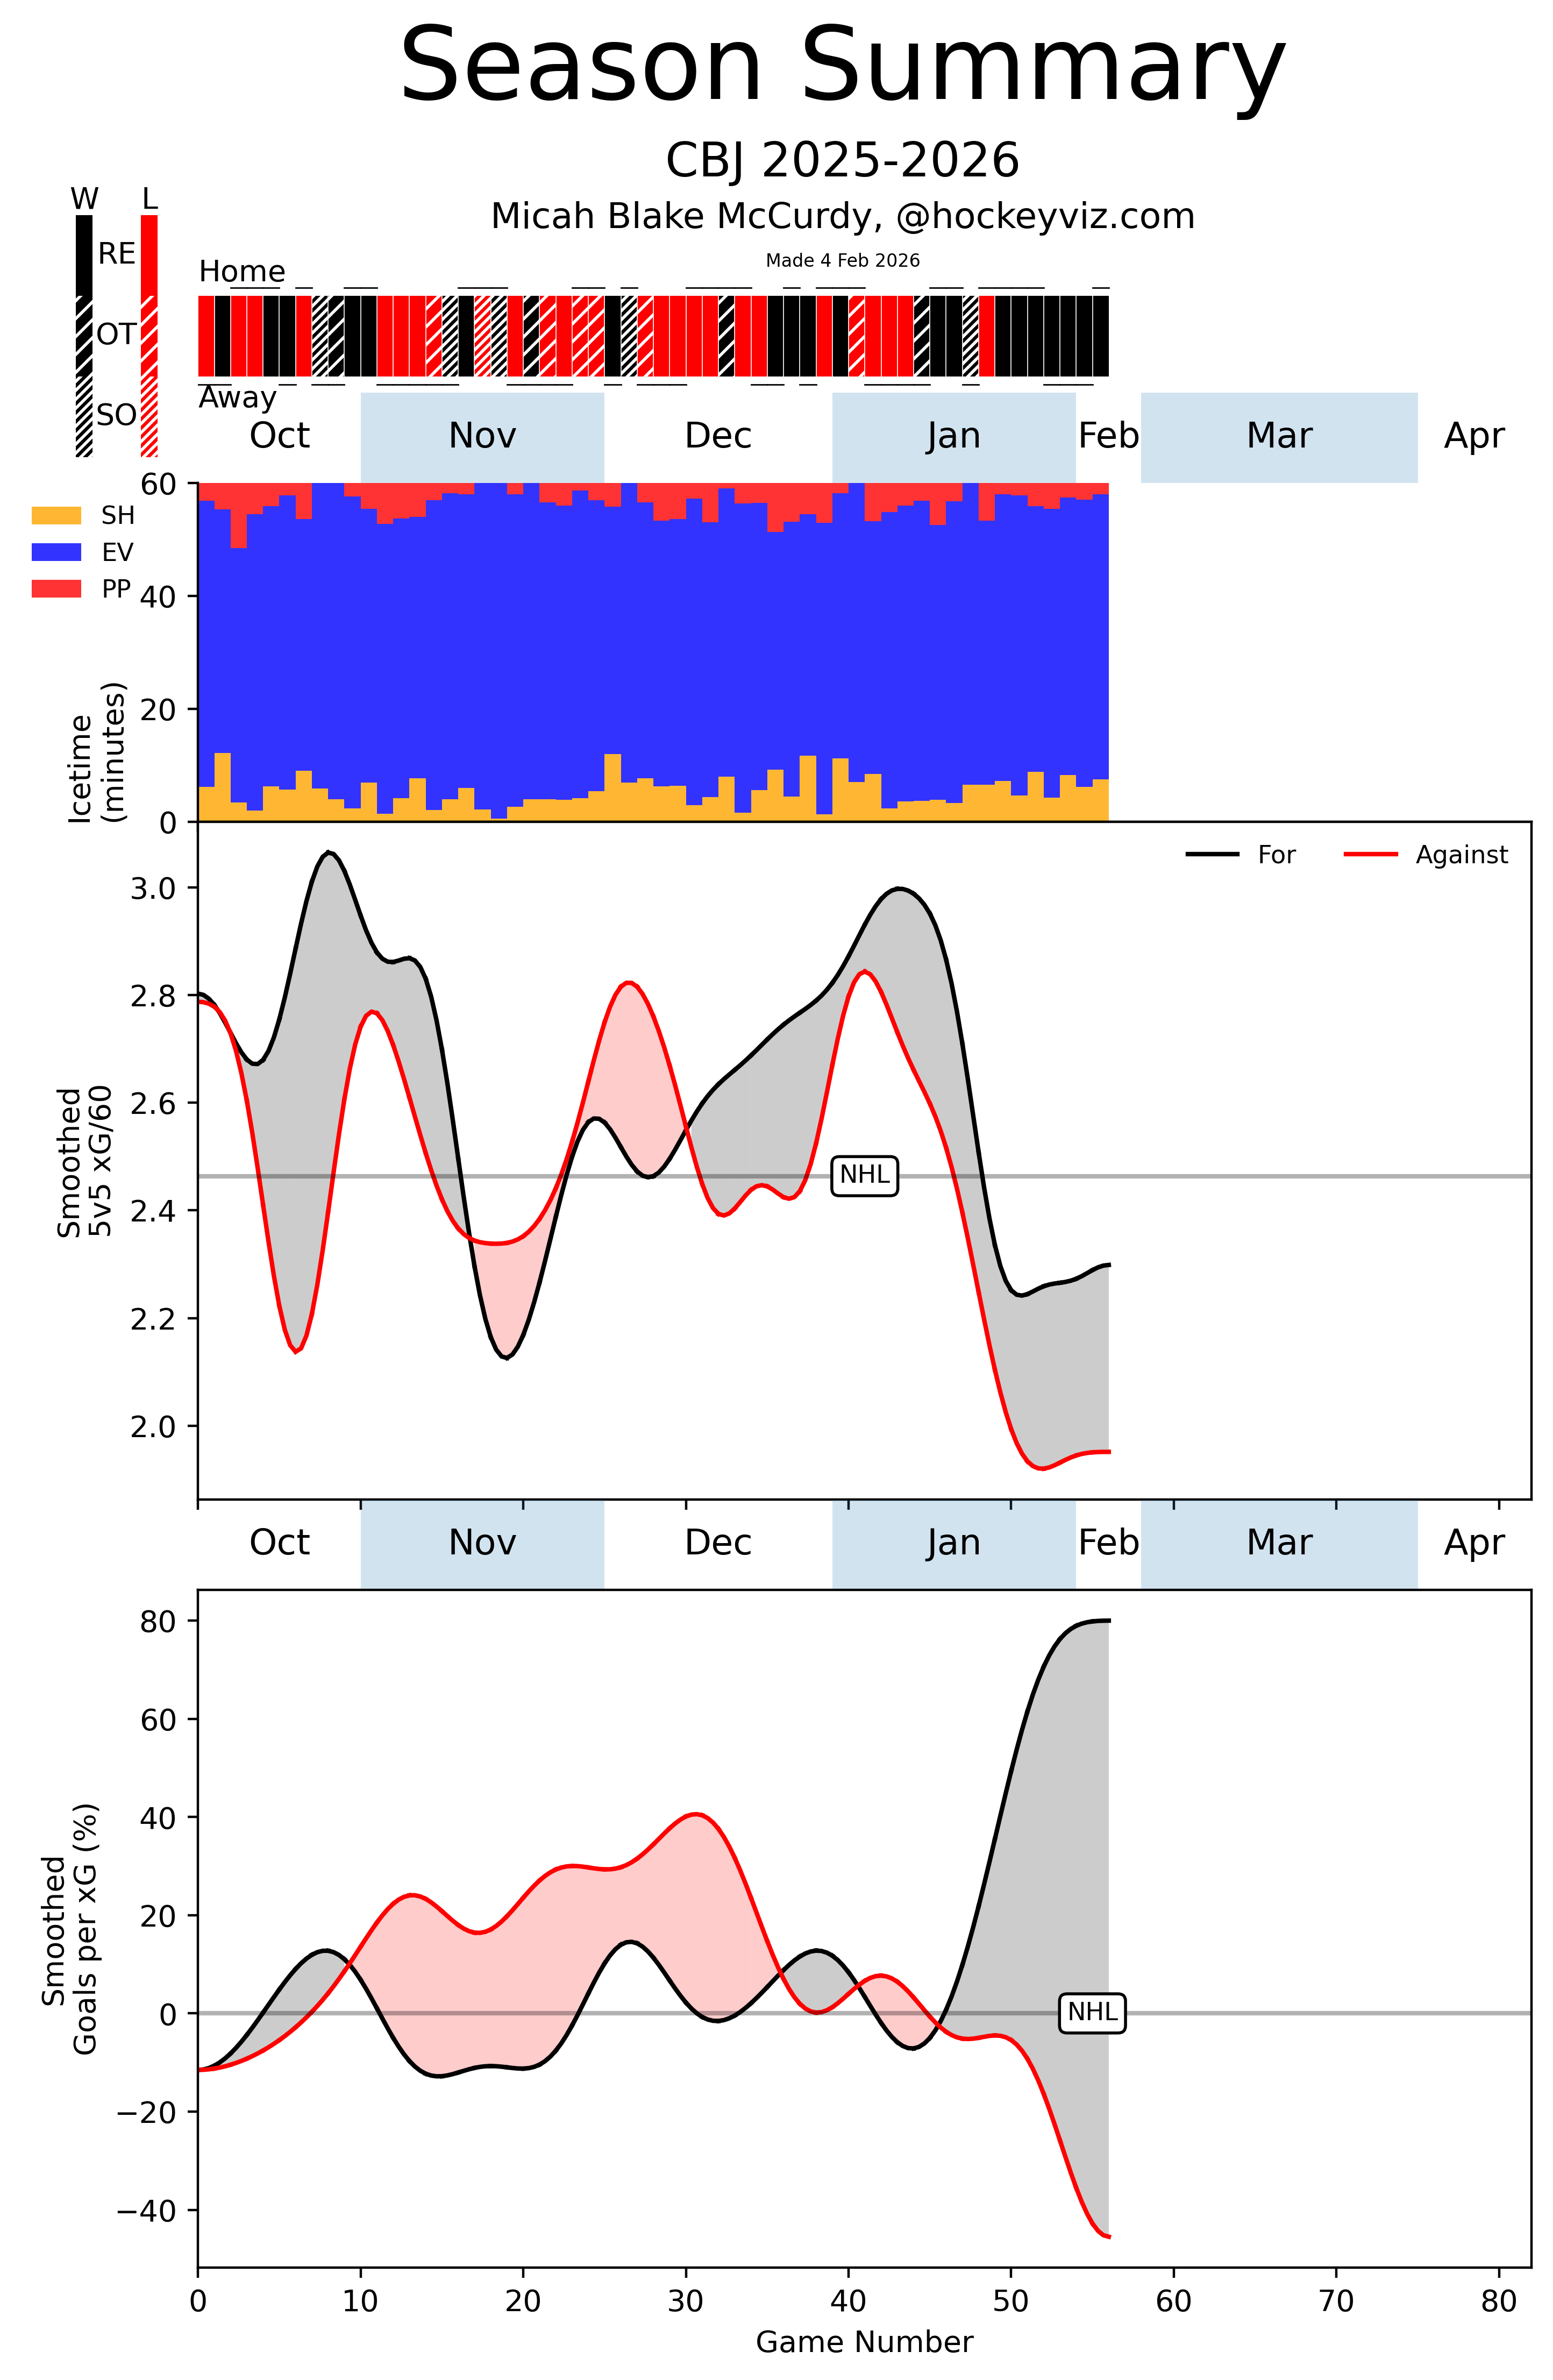
The “Bowness Effect” is quite easy to observe. The instant slide into a “low event” and defensive hockey, an outrageous explosion of goalscoring and the best stretch of goaltending the Blue Jackets have seen yet this season.
There’s more to be said at some point on the impact of coaching on teams and players but this is perhaps one of the clearest examples of just how drastic systems can influence on-ice performance.
To add some context, I think we should consider the relative weakness of the schedule, the prevelance of backup goaltenders and the inborn motivational gap that the Blue Jackets had over every other team they played as part of the leadership/FO directive of “win or go home”.
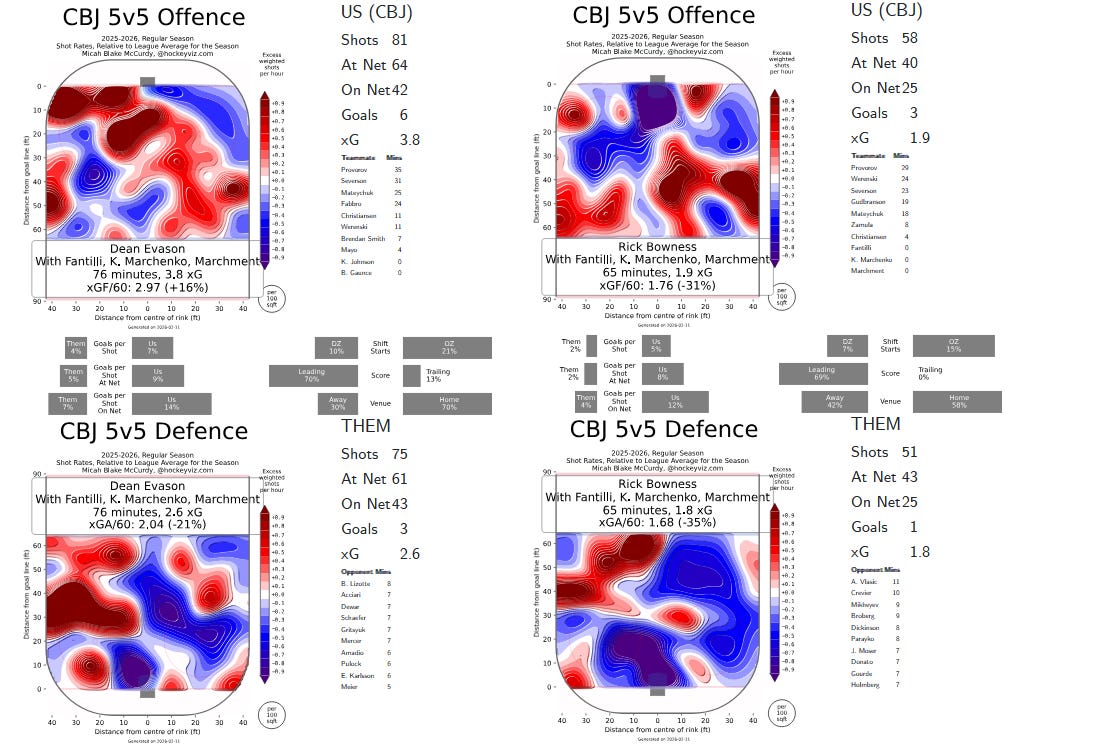
Given that the above performance is on something of a smooth curve, we can turn to the Environment Distiller to look at the heatmaps more directly.
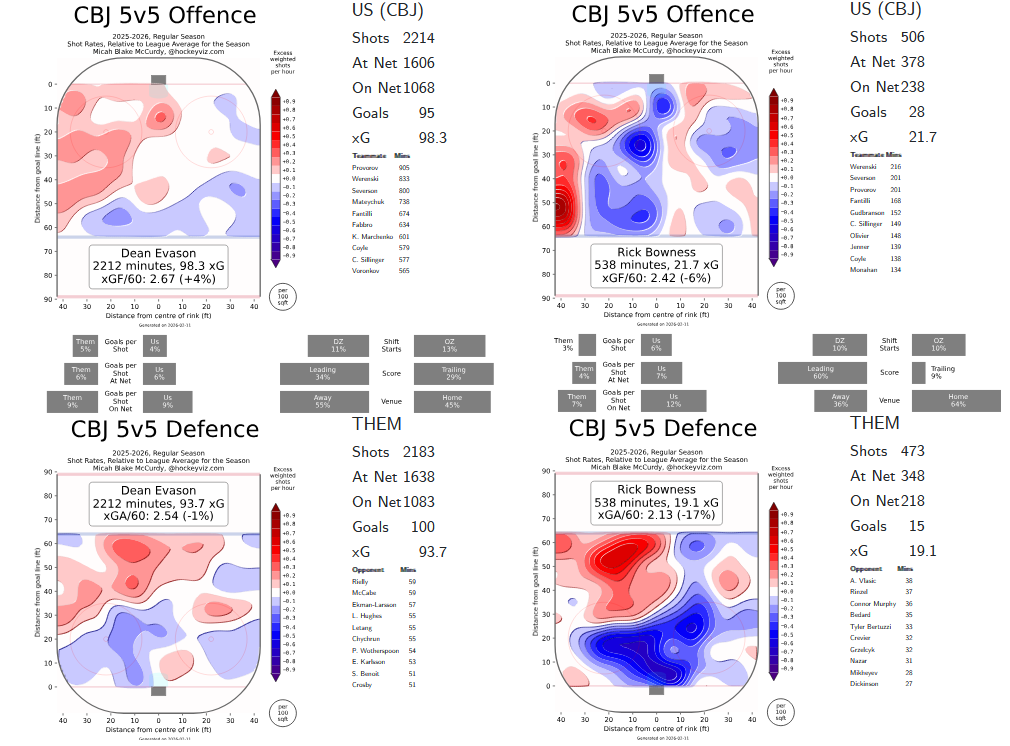
Same conclusions but more definite answers. The Blue Jackets, under Rick Bowness, are a below average offensive team and a very good defensive team. Compared to Dean Evason where they were at slightly above average offensive team and a near average defensive team at 5v5. The finishing and goaltending flipping has solved a ton of issues.
We’ll see some of this reflected in the tracking data later on in the breakdown but it’s worth touching on a few key drivers up to this point.
The formation of the Zach Werenski-Damon Severson pair has been completely dominant from a 5v5 play-driving perspective. Bowness matches them as hard as he can against top forwards, though this is a stretch without complete top lines, and within that context they’re grading out as one of the best D pairs in the league.
You’ll notice, perhaps, the 6 goals condeded on 3.9 xG, which is something they will absolutely have to reconcile, but driving play this hard is nothing but a good thing.
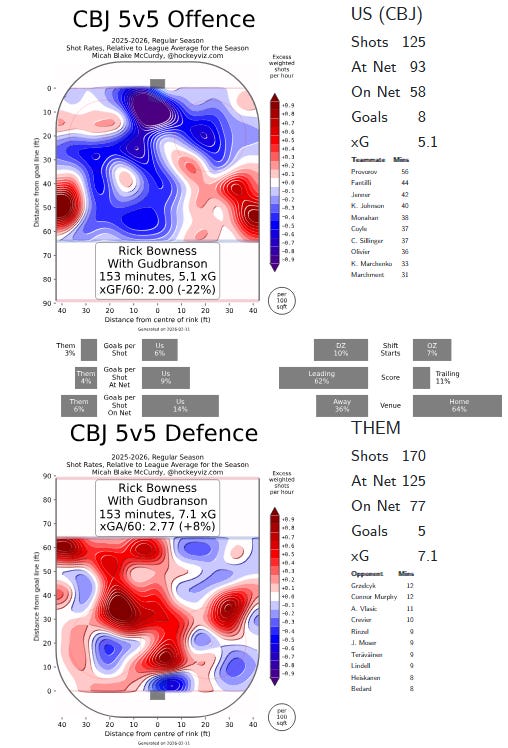
Erik Gudbranson’s return has been an abject disaster at 5v5 which is going to make evaluating some of the defensemen difficult as well. Any minutes spent alongside him have been complete struggles which is perhaps also why Damon Severson will grade out as the best play-driver from an on-ice chance share perspective.
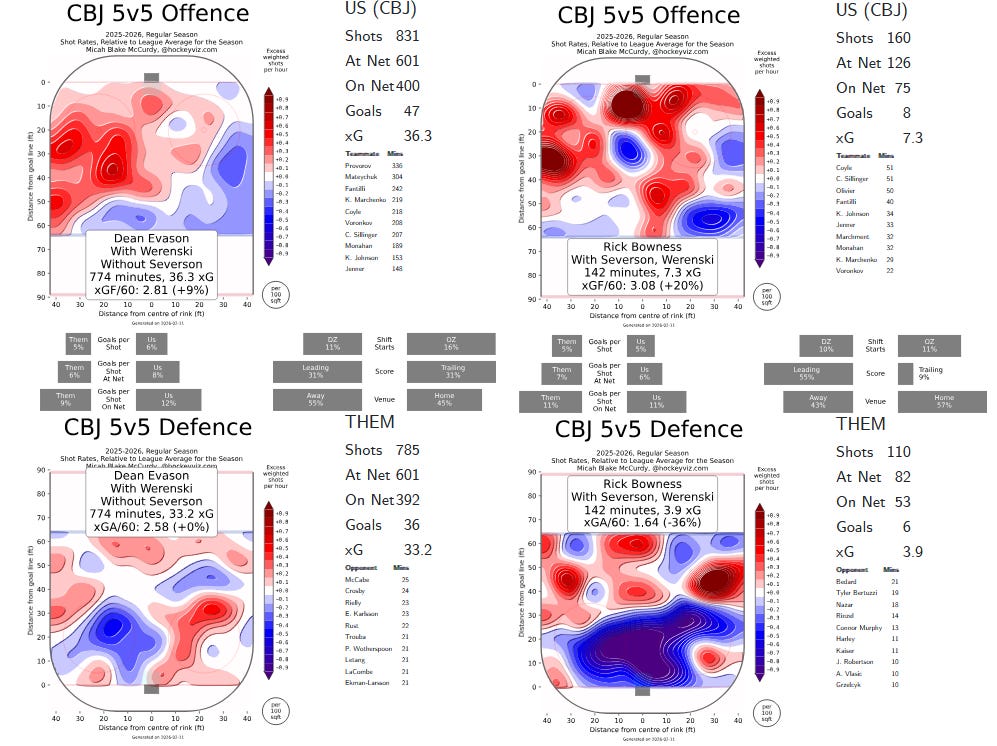
The downside of the coaching change has been the complete struggle of the newly formed “top line”. Limited minutes on both sides of the coaching change but completely different performances.
Under Evason, it was a brilliant line driving a big advantage and doing it without Zach Werenski on this ice. He literally only shared 11 minutes at 5v5, the same about as Jake Christiansen.
Under Bowness, the line hardly wins matchups, hardly anything happens when they’re on the ice and they spend much more time proportionally with Zach Werenski. That’s a big problem for the team especially considering how many offensive minutes this line gets. Charlie Coyle is soaking matchups and Sean Monahan is usually getting the secondary minutes against top players.
Marchment was the perfect addition to the group because of his ability to perform within Evason’s system constraints but Bowness, at least offensively, doesn’t apply those same constraints. The result has been a line that struggles to connect their plays to eachother.
This cuts in both directions. The Blue Jackets have been winning while their top line has been completely absent. If they learn to create in the new environment, the Blue Jackets might just be a really good all-around team instead of just a low-event defensive team.
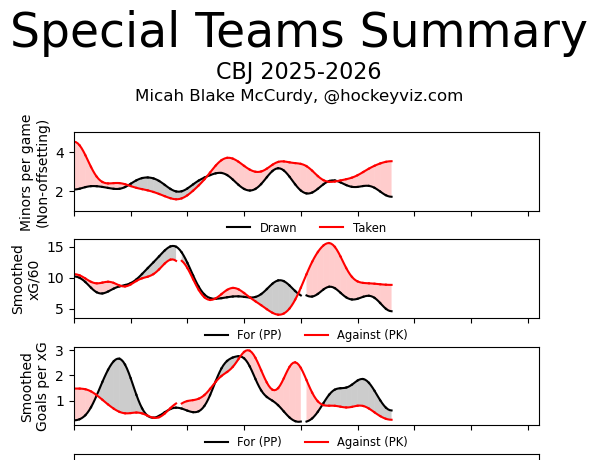
The Blue Jackets' Special Teams are still really bad. They’re a big negative on penalties and both sides are settling into poor results relative to the league. Perhaps goaltending and finishing are something we should pay attention to more, especially if they represent a secondary layer of quality that isn’t measured via NHL PxP, but for now still an area of concern.
I don’t want to get too far into some things we’ll see later, so I’ll leave it here for now.
Offensive Contributions
The biggest reason to track every game this year is to peel back the layers of mystery behind the creation of each and every shot. The boxscore, and the NHL, only gives us the shooter and that can make it difficult considering the well researched importance of passing relative to continued performance and player quality.

If you are unfamiliar with what exactly I’m doing, read the above explainer. There have been minor variations in the project since then and hopefully more coming soon with the break in the coming weeks.

The most recent sample of offensive contribution data comes alongside plenty of other analytics in the Midseason Breakdown. This was written around a week before Evason’s firing and can be used as a good representation of the “Evason Era”. Conceptually, I should probably compare the changes between the two directly but I’d rather keep this specific breakdown more concise. If you’d like to compare players between situations, pull up that breakdown (assuming you’re not on mobile) and you can probably go chart by chart.
Shot Contribution Rates
We’ll start with “Shot Contributions” which is a simple count measure of each “shot attempt” and pass that leads (more or less) directly to a “shot attempt” combined into one simple number.
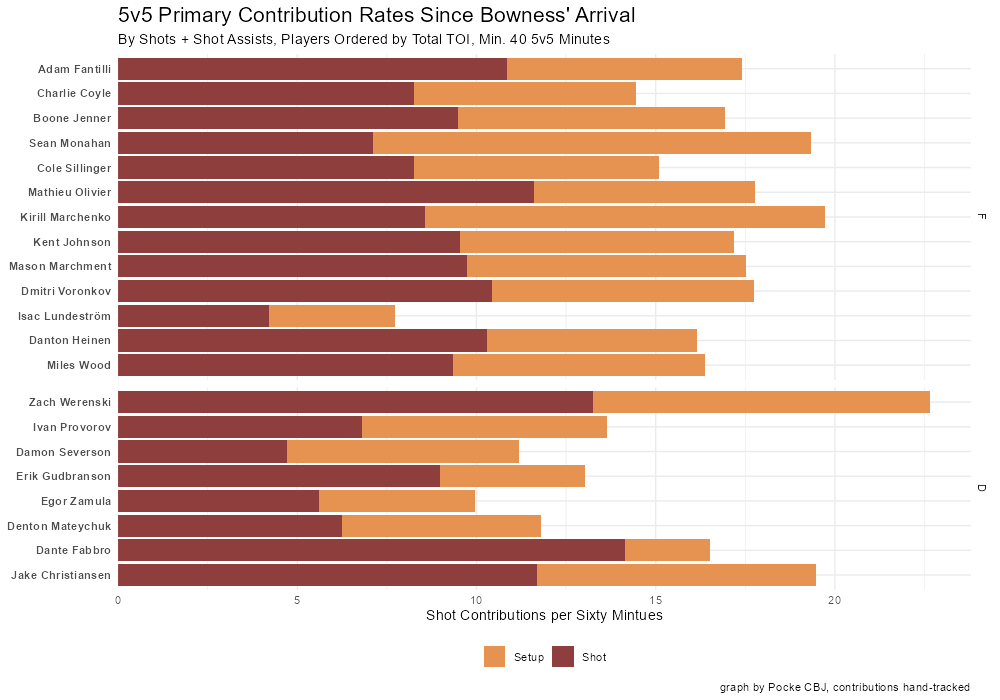
The earliest observations include a homogenization of the contributions of the forwards.
If you decide to look back at the Evason data, you’ll notice that Fantilli and Marchenko were contributing to offense at a much more significant degree than the rest of the group. Marchenko still leads forwards but under Evason he was above 30 Shot Contributions/60 which is well above the bounds of this chart.
That, of course, perhaps highlights how difficult it is to analyze players in entirely different team contexts and why analytics put so much emphasis on normalizing players across different situations.
It’s not just Kirill Marchenko that is contributing to offense at a suppressed rate, it’s everyone. Under Evason, the Blue Jackets had 11 forwards above 20 SC/60 and under Bowness there are none. Similarly, all Evason defenseman had more than 15 SC/60. Under Bowness, only Zach Werenski and the duo of very limited minute defensemen (Fabbro and Christiansen) had more than 15.
The most consistent players between coaches are Zach Werenski and Isac Lundestrom. Werenski is now the king of offense, still contributing at a marginally suppressed rate, and Lundestrom has carried over his complete lack of final touch offensive contributions. Putting him on the first line seems extra curious from that perspective.
Diving in more specifically, we see the emergence of Sean Monahan and Kirill Marchenko as playmakers. They’re the best forwards on the team from that perspective and that might help explain why they’re the two most voluminous contributors.
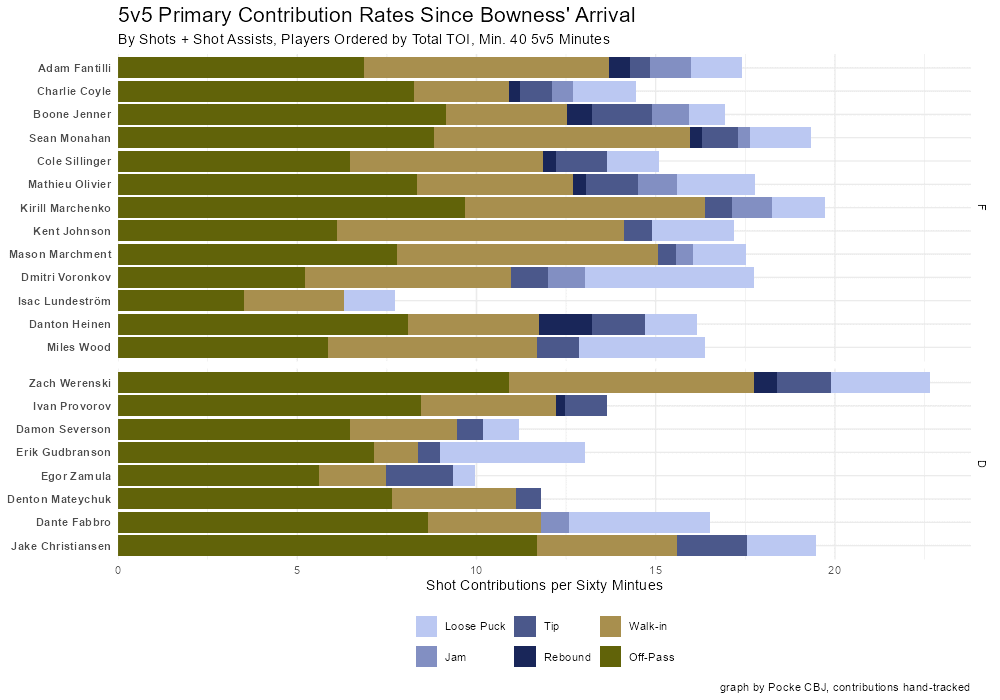
Perhaps partially aligned there, is that Monahan and Marchenko also create the most controlled offense with Johnson and Marchment bringing up the next two positions. Johnson was in a similar position under Evason from a rate perspective, you probably just couldn’t tell because of the significantly diminished minutes (which have also returned under Bowness).
Kent Johnson, in both cases, does seem to lean on “walk-in” contributions relative to “off-pass” which might point to his excellent involvement in “build-up” returning but also an opportunity for improvement. If he wants to be an excellent top-six player, he’ll have to find of these direct-to-shots opportunities.
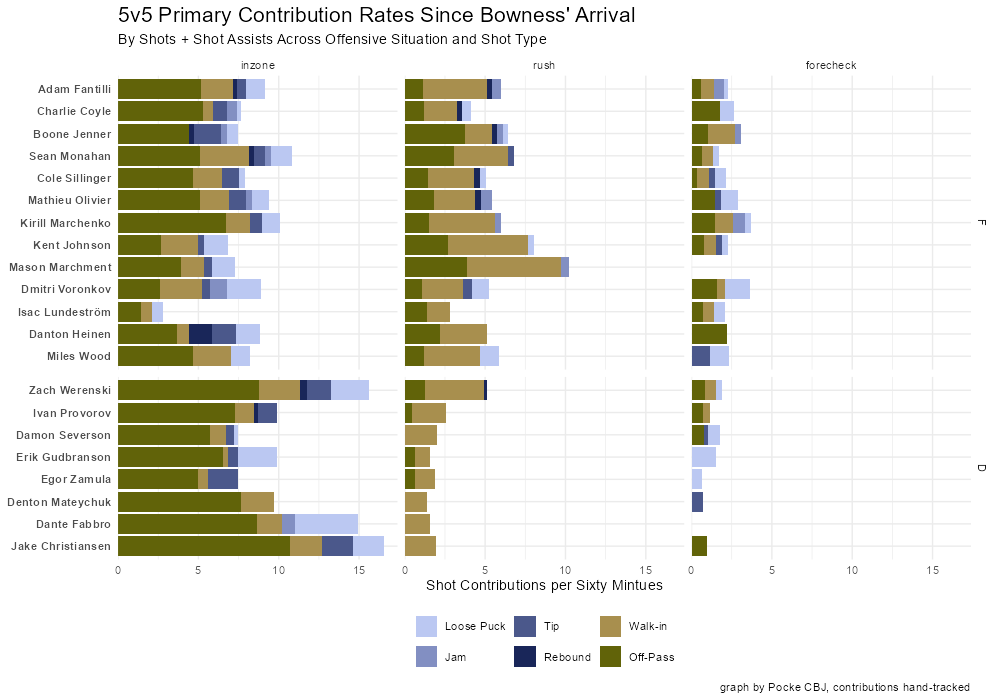
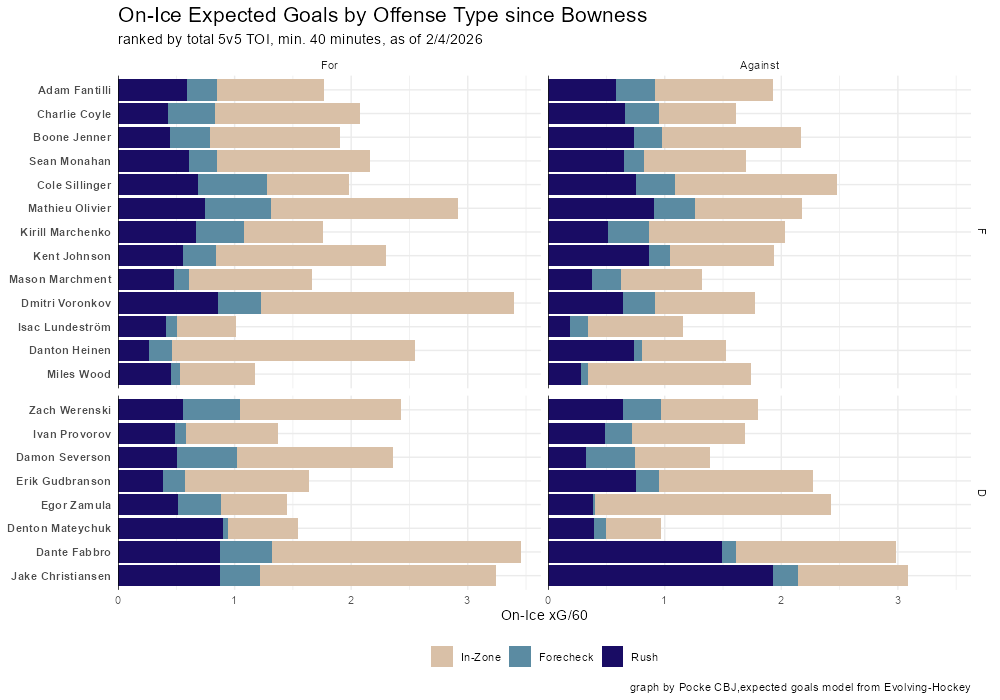
Diving into offensive situational shot contributions helps tell us the story once again, especially in continuing the storylines from above.
Sean Monahan and Kirill Marchenko stand out among forwards in terms of in-zone contributions, despite diverging relative to Evason. Monahan has maintained about the same amount of total contributions but significantly more come from controlled offense and that means, relative to Evason’s Blue Jackets, he’s improvement significantly. Marchenko, just behind Monahan instead of ahead, has seen quite a drastic reduction where he as above 15 SC/60 previously and no forwards come really close to his contributions since then.
Jenner and Kent Johnson have struggled to create much of interest in-zone. Johnson continues to struggle here whereas Jenner has gone from one of the top players under Evason. Critically, Coyle and Sillinger have experienced a drastic reduction in in-zone shot contributions.
Defense contributions are down across the board though Werenski is down here relative to the rest who were a more homogenously contributing group.
In terms of rush offense we see quite a large difference. The Blue Jackets have lost a ton of rush offense from nearly every other player.
Marchment and Kent Johnson, for perhaps all the struggles they have in-zone, lead the team in rush contributions. Only Marchment is performing close to the bevy of players above 10 rush SC/60 under Evason. Excellent news for the Blue Jackets’ skilled wings and quite clearly evidence for why KJ might lean so heavily towards “walk-in” contributions.
Perhaps the most interesting pattern is the relative decrease in off-puck rush contributions from the majority of forwards and all of the defensemen. That makes sense, considering how many bodies Evason aggressively threw forward to create offense. In his system, the “active triangle” didn’t care what position the player played but where they were on the ice. This meant that defensemen were often “wingbacks” in transition situations and I think that’s explains plenty of the reduction in rush volume.
The more collapsed and defensive Bowness sytem has dramatically reduced the rush offense from all players and, it looks like, made it more heavily lean to “walk-in” style creation. I think there’s good evidence that this means there are simply fewer bodies available as threats but that could come from myriad places.
Less eager to leave the zone and therefore more fatigue given the collapsed defending? Eroding of rush structure means players are struggling to find appropriate solutions? Defensemen hanging back meaning less stress on defenses? A lot of potential explanations and certainly a lot of fruit to evaluate with more sample size.
I don’t know too much what to say about the direct “forecheck” offense either but it does seem that Evason’s team was much better in that regard as well.
Not scoring our way into the playoffs, indeed.
Expected Primary Points
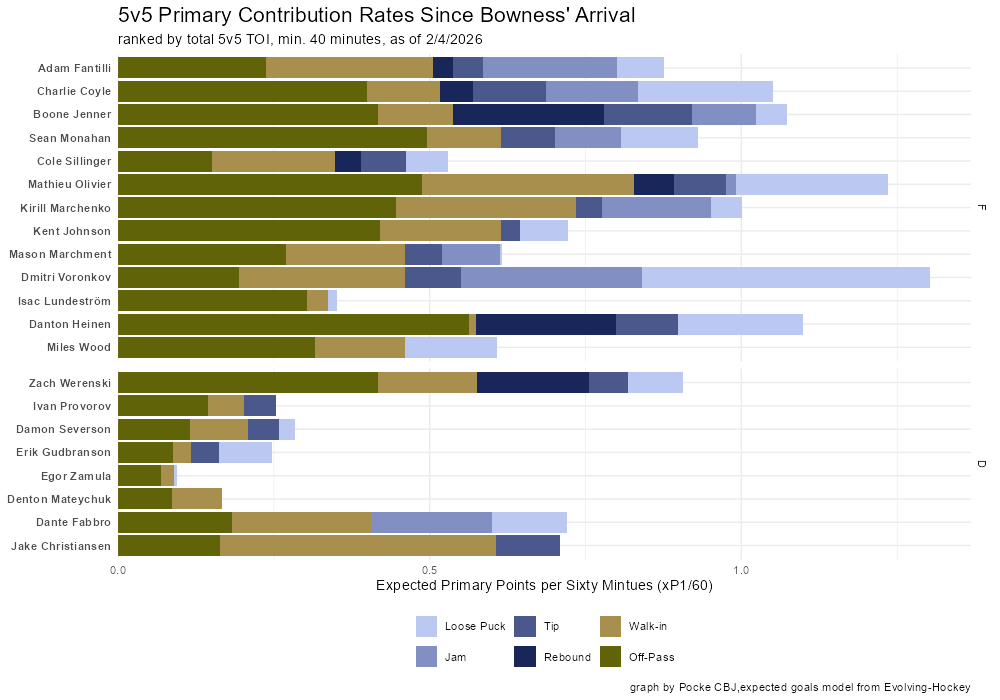
I hesitated sharing the “Expected Primary Points” contributions at all because of the increased volatility of the sample size and more recent revelations about the poor-quality of Evolving-Hockey’s expected goals model but we’ll try to pull out some information from what we’re given anyway.
A couple of interesting points leap out, namely, the dramatic underperformance of Cole Sillinger relative to shot contributions but the general struggle of all of Fantilli, Coyle, Jenner, Voronkov and Marchment at creating any controlled offense. I wouldn’t write off the “net-front” offense that we’re seeing from some of these critical players but the Blue Jackets’ high-skilled contingent is going to have to find a way to produce better here.
Once again, across the board, offense is down. The Blue Jackets had 7 near 1.5 xP1 producers under Evason. Under Bowness, Voronkov is the only one that comes close with a dramatic uptick from Olivier as well. A not insignificant factor is the near across the board reduction in rebound (+ putback) and tip offense. Jenner and Heinen are the only significant rebound contributors where every other forward his struggled to find these pucks.
The most interesting aspect, at least relative to Evason, has to be Zach Werenski. He saw a dramatic drop-off in expected primary points relative to shot contributions, which makes a ton of sense given that defensemen play near the blue-line. Under Bowness, though, he’s producing near as much as many of the forwards and hasn’t experience a drop-off at all, especially when comparing controlled xP1/60. I am choosing not to look too much into his rebound contributions but perhaps more dangerous shooting opportunities are leading to more rebounds.
Dean Evason, quite clearly, had system designs that increased net-front chaos opportunities and he asked a lot more of his defensemen. Perhaps they’re committed to shooting less, perhaps it’s a symptom of the struggles. Perhaps again it’s all an artefact of the significant time the Blue Jackets have spent in “leading” game states, as we’ll see shortly.
Expected vs Observed Primary Rates
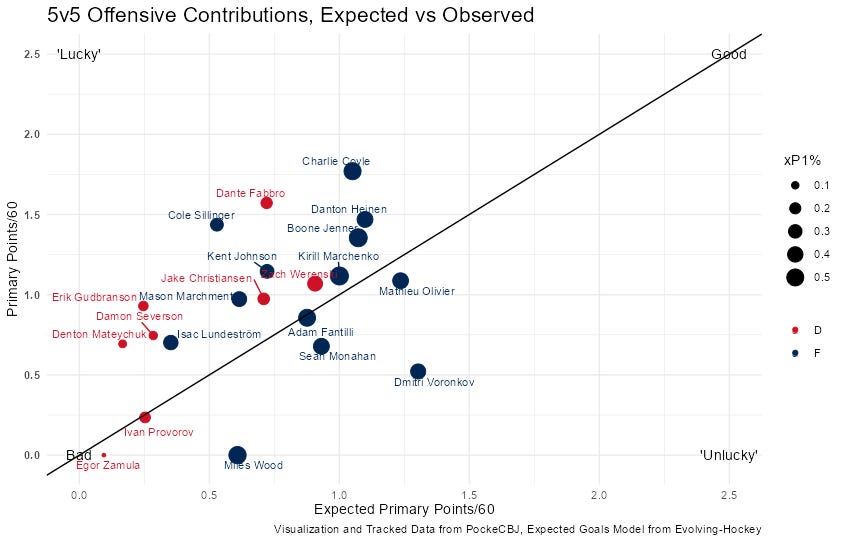
Now feels like an excellent time to bring back the “performance relative to expectations” chart with it’s not quite humorous axis lengths.
A couple of key factors. Quite obviously the scoring of the matchup line does not feel sustainable and that’s spearheaded by Charlie Coyle who has scored 10 points in 11 games at 5v5. That puts him tied for 5th in the NHL in that span. Only Nathan MacKinnon has come close to matching that 5v5 scoring rate on the year.
Attached to that performance is Cole Sillinger who, despite seeing a significant reduction in his underlying contributions, is scoring at a quite increased rate. Mathieu Olivier, one of the best contributing CBJ forwards under Bowness, has not seen “adequate compensation” for his efforts.
Similarly, and a point of severe contention, has been Adam Fantilli’s performance. He’s been annointed the CBJ 1C and has been the most deployed forward across both coaches. He has 2 5v5 points, a goal and a primary assist, and it appears that he has getting pretty much exactly as he has earned. This has been a theme running through the entire breakdown so far, but it’s quite clear that the Blue Jackets need to find a way to get the best out of their young center.
Player On-Ice Performance
I’ve already used HockeyViz to touch on a couple of the key on-ice drivers of the coaching transition, but now I’ll go through the differences in tracking data as well.
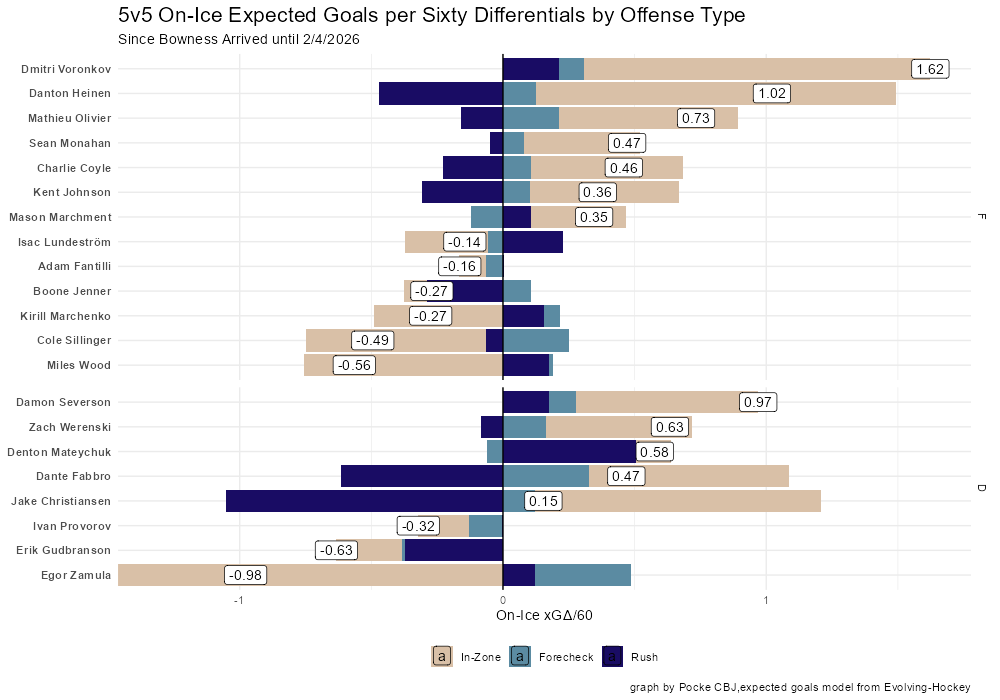
Most of the same things apply. Severson-Werenski-Mateychuk have been fantastic. Provorov has struggled, though he shared plenty of time with Erik Gudbranson as well. Across the board, the Blue Jackets are conceding more rush offense than they are creating btu generating some massive in-zone differentials that are certainly helping ease the pain.
The Blue Jackets’ top-line with Fantilli-Marchenko has been struggling mightily in part due to plenty of time spent with Cole Sillinger.
At the same time, Dmitri Voronkov and Danton Heinen in their specific positions have brought significant chance differentials. The matchup line, at least away from Sillinger, has been great as has the combination of Monahan-Johnson.
Same themes continue, the Blue Jackets are going to need to get their top offensive players going and perhaps share the offensive burden more evenly with Monahan and Johnson if they can’t.
I don’t particularly like this chart but I’ll post it here in case anyone enjoys it and wants to take a closer look. The only thing that stands out is how little happens when Denton Mateychuk has been on the ice. Sub 1 xGA/60?? Nuts.
Contribution Share of On-Ice Offense
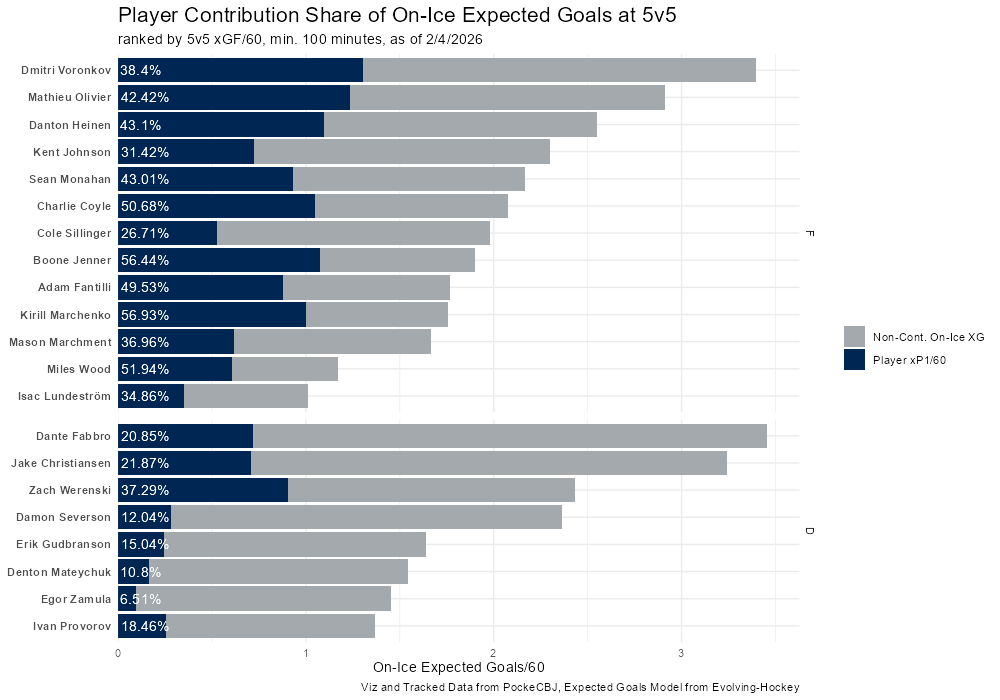
The incorporation of on-ice xGF/60 also brings us the opportunity to demonstrate on-ice chance share contributions as well. If you’re following along with the previous breakdown, you might notice that the player contribution percentages are quite different. That is because I made a big mistake when filtering the data to create percentages the first time! Essentially, the previous percentages are the share of Player Contribution Share of On-Ice Expected Primary Points rather than On-Ice Expected Goals. Any shot that had an assist was double counted.
Now, we see much bigger numbers. Continuations of the same story but perhaps something interesting to latch onto. Sillinger and Johnson, who are both responsible for transition and perhaps hang-out in the middle of the ice in-zone, see much fewer contributions to the general share of on-ice chances. Perhaps the wall-players are going directly to the net or struggling to find off-wall passes otherwise.
Voronkov and Jenner, as big net-front players, have an outsize influence on chance-share.
Zach Werenski stands out in terms of both offensive driving but also involvement. A very much eye-test matching defenseman from that perspective.
Third Period Performance

A key point of contention under Dean Evason was the blown leads. Without the almost continual losing of third periods, the Blue Jackets might be cleanly in the playoffs. The players seemed to believe that they started playing differently with a lead, sitting back more instead of taking it to the other team, and I suppose conceptually that has stopped entirely.
It seems more likely that Bowness is just more conservative all around and therefore the “play style differential” is perhaps less exaggerated between losing and leading but we honestly haven’t really seen much losing hockey in that time, so it’s going to be hard to tell.
In any case, let’s just rerun the scripts and see what we see.
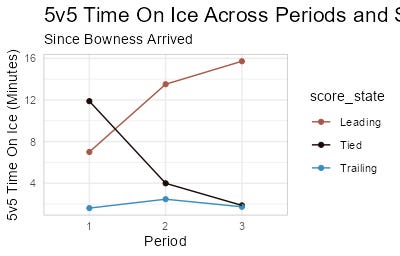
The 5v5 TOI distribution confirms how much the Blue Jackets have been leading. Great first periods have lead to a more time leading in the second period on than in tied or trailing game-states combined.
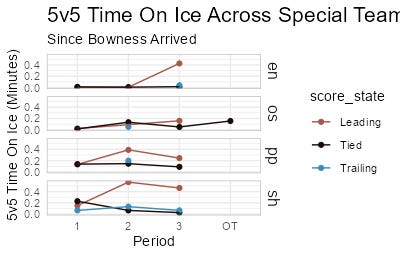
The same goes for special teams as well, though this does make me wonder whether part of the “penalty differential” problem is just how much time the Blue Jackets spend leading as well. Hard to say given just how strongly the ice-time allotment is distorted but something to think about.
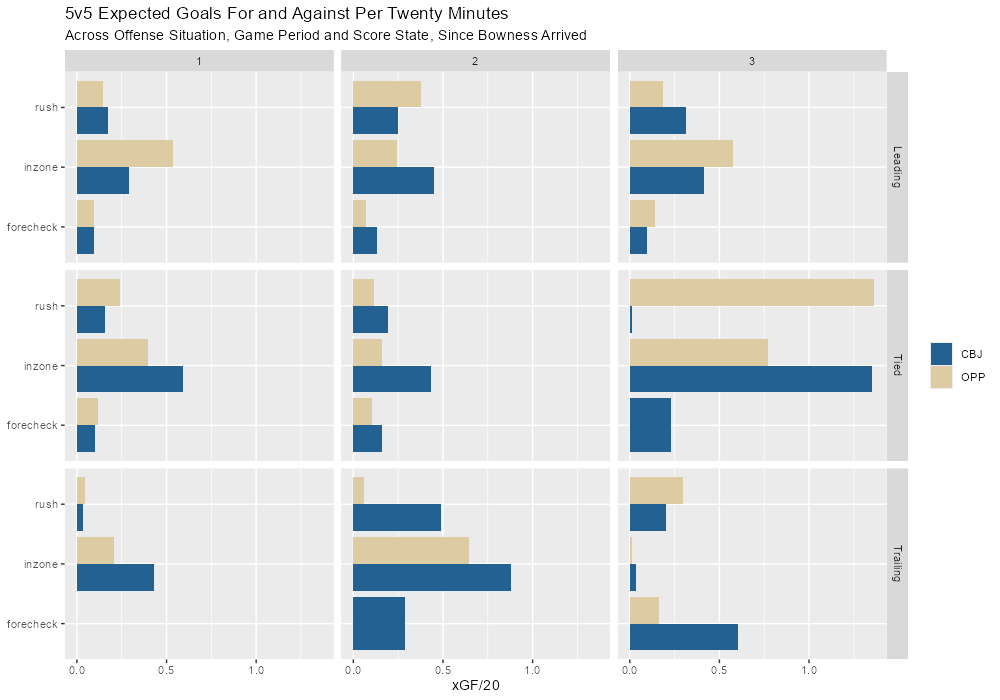
Looking at exclusively 5v5, there’s not too much to say about Bowness relative to third period collapses.
They are losing their minutes but it doesn’t look totally different from the other situations. It appears, somewhat paradoxically, to be their most advantageous rush-creation game-state. If the Vegas comparisons are accurate, then perhaps their shot-packing shot blocking is the new primary avenue for creating better rush looks.
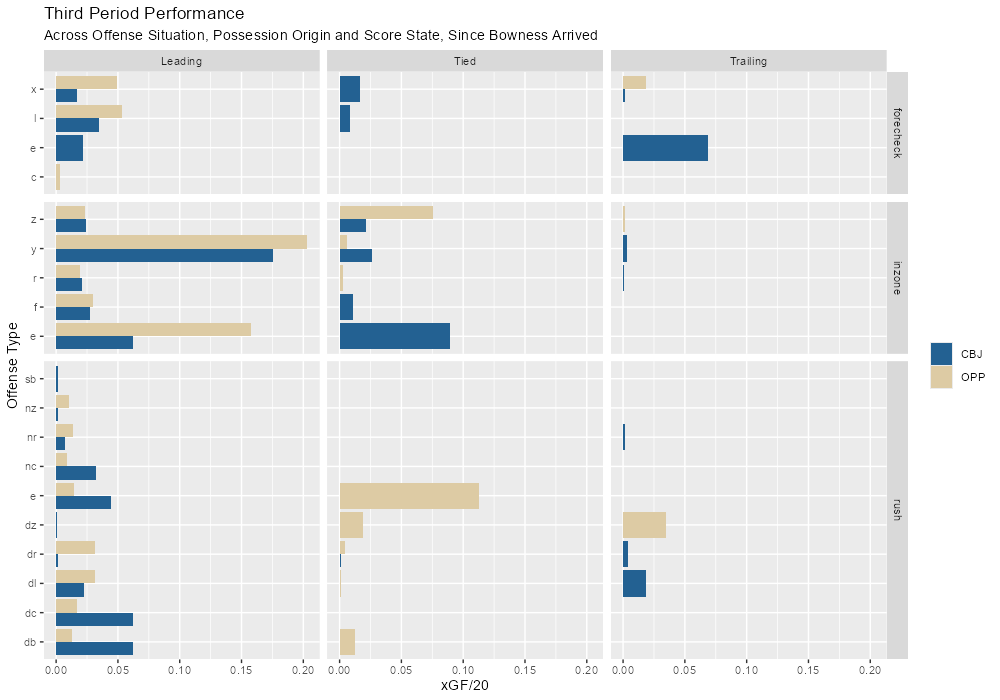
Thankfully, we can test that via looking at only the third period across the different score states but with more depth relative to the offensive situations.
While the sample on tied and trailing is outrageously small, there is a good amount of evidence to suggest that the Blue Jackets are indeed creating more counter-attack offense, and especially more offense coming from the D zone, when they are protecting the lead. They’re also giving up more deep regroups and dump-in retrievals which makes some sense considering the extra in-zone time.
They are, mostly, going even in-zone with the exception of rebounding. The net-front defending might be a continued point of contention but it’s at least good that they’re going close to even in the other varieties because those suggest more possessional qualities are still positive.
A short and too brief look into the third period but the continued wins instead of devastating losses and shootout victories perhaps tells us as much as we can get out of 11 games.
Goaltender Performance

The perhaps biggest story since Bowness’ arrival, and I suppose prior to it, was the divergent performance of the two goaltenders. It got to a point with Dean Evason where he basically refused to play Elvis Merzlikins in any circumstance. Bowness, on the other hand, seems to love the goaltender and has given him a good run of starts. Given the run of shutouts and dramatically improved 5v5 goals against, Bowness’ Prime Directive, you have to think it’s all been great.
Given what we can measure, it has been great. Both goaltenders are putting up fantastic 5v5 performances. Elvis Merzlikins, when it comes to stopping the puck, has actually been better than Jet Greaves! In terms of freezing the pucks and allowing rebounds, Greaves is still the superior goaltender at this strength.
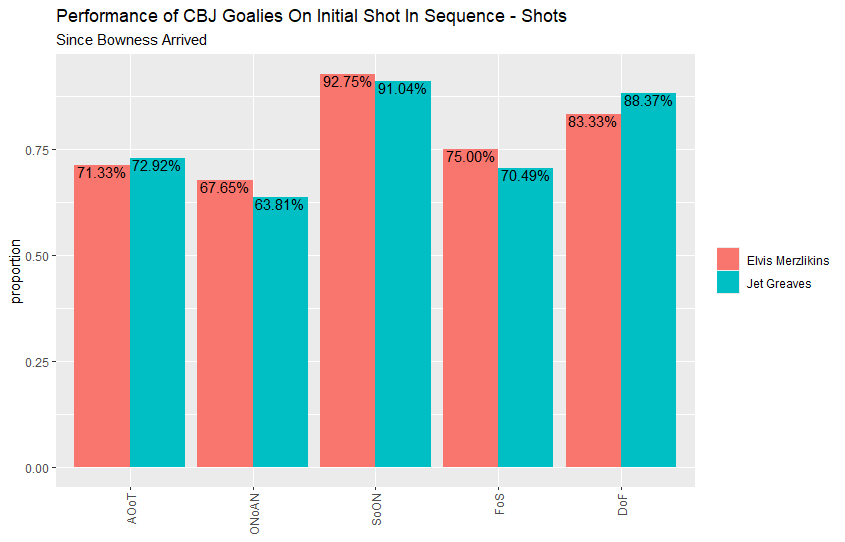
When we filter down to only the initial shot, as we did in the initial analysis, pretty much everything above holds true. Greaves is allowing more “opposition recovered” shots but we’ll get into the meat of the issue when we look at “shot danger allowed” in the next chart.
Aside from save percent, where both goaltenders are great but Elvis has the advantage, Greaves still looks better across the secondary metrics of “forcing misses”, “freezing pucks” and “preventing dangerous rebounds”.
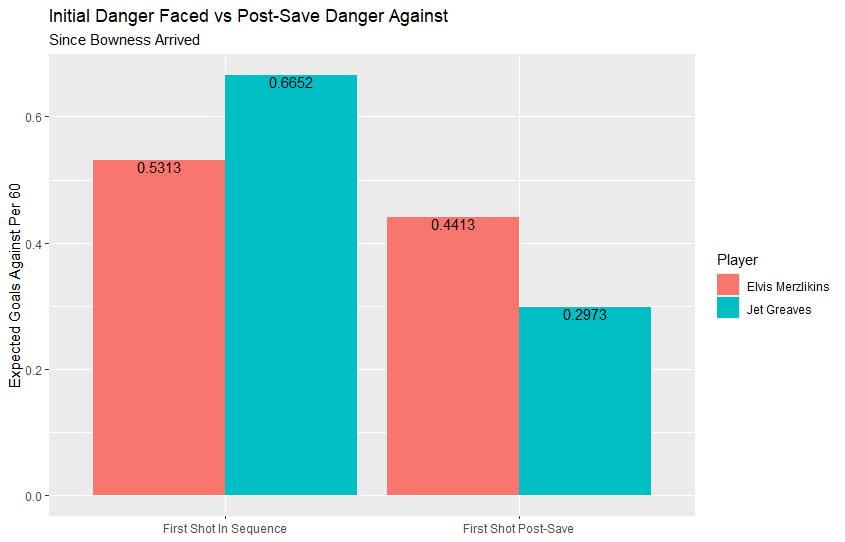
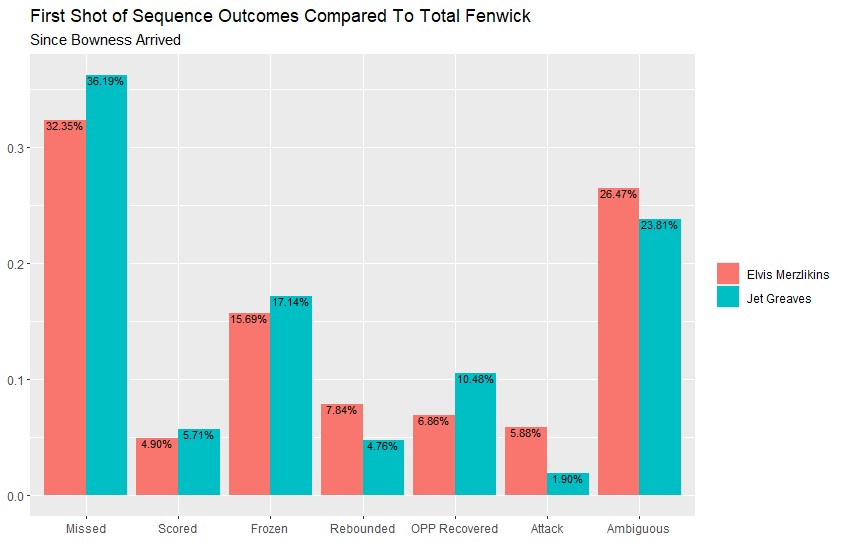
What’s interesting, at least from this perspective, is that there might just be a reason Elvis is performing marginally better from a save percentage perspective. The Blue Jackets, in front of Jet Greaves, are allowing more danger on first-shots-in-sequence from a rate perspective.
In the wake of those initial saves Jet Greaves is still saving the Blue Jackets more danger against with his excellent rebound control.
Given that we’re observing an incredibly small sample size, it’s possible these figures will normalize with more time. Worth pointing out that, under Evason, the Blue Jackets were conceding around 0.8 xGA/60 on initial shots in the sequence.
Both goaltenders are seeing improved defensive environments and that fact, depending on how you interpret the data, could mean that Merzlikins’ rebound control as actually not improved at all.
83% of initial expected goals were returned in the form of rebounds/recovered offense for Merzlikins under Bowness whereas that figure was around 72.5% under Evason. Jet Greaves, though his post-save xGA/60 is at a similar volume, is also returning more chances going from 33.8% of initial expected goals to 44.7%.
Far too early to conclude much but still evidence that Jet Greaves is the better 5v5 goaltender. When zooming out to all shots performance, we can still see that Jet Greaves’ 6 goals allowed on 11.42 xGA is still better than Merzlikins’ 9 goals allowed on 10.39 xGA (according to Evolving-Hockey).
Where the formula gets tricky is on the penalty kill which is an even more fractured sample. In the 11 games since Bowness joined, Elvis Merzlikins has conceded exactly 1 goal on 5.45 xGA across 26 minutes of PK time where Greaves has conceded 5 goals on 5.13 xGA across 26 minutes of PK time.
I would be this sample is simply not worth looking into but it does mean that the PK, a significant weakpoint for CBJ, has perhaps been bailed out by a hot-streak from Merzlikins. If there is some valid signal here, perhaps Merzlikins’ size is some sort of an advantage, the Blue Jackets might look to utilize that strength to offset the next biggest weakness on their team.
Acccording to Evolving-Hockey and in all-situations among goalies with minimum 100 unblocked shot attempts faced since Bowness was hired (the qualifiers of all qualifiers), Merzlikins ranks 6th with 0.58 goals allowed per expected goal where Greaves ranks 13th with 0.68 goals allowed per expected goal. According to the HockeyViz method, that puts them at -42% and -32% Shot Danger respectively. I won’t compare that with HockeyViz’s chart because of the difference in underlying expected goals models but know that it is certainly exaggerated. Evolving-Hockey has far fewer goales saving under expected.
If both keep this up, the Blue Jackets will have a top of the league tandem. If 5v5 performance and freeze rate are the better predictive variables from 6 game samples, Jet Greaves might still be the 1A starter moving forward.
Wrap Up
Waddell’s extension negotiations and resulting roster movement considerations aside, returning to some of the old analysis with this look into Bowness’ certainly yields some key factors for future attention.
The first, and most important, item of business it to get the Blue Jackets top-line going. I could see this happening in a few ways.
First, Bowness’ mini-bootcamp helps provide a little more structure and gets Marchment-Fantilli-Marchenko to connect better and create more offense. If this happens, the Blue Jackets might just be more than a low-event team and legitimate playoff threat in the East.
Second, rewarding Sean Monahan for his return to form post-injury and reconnecting him once again with Kirill Marchenko. If the coaching staff can find trust in their hearts for Dmitri Voronkov, reuniting the line that carried games last season would be a brilliant decision. Monahan’s dramatically improved in-zone and rush playmaking look like they would put Marchenko back in the driver’s seat as the best offensive performer for the Blue Jackets.
Adam Fantilli has taken a great step forward this season but the reduced structure under Bowness needs some revisiting. Marchment and Kent Johnson look like great rush players so I see no reason not to create an offensively focused rush-line borne of the players that look well suited for it.
How the team intends to handle the Werenski-Severson pairing also bears watching, especially with respect to the rest of the defense group. They’ve been dominant and they desperately need the actual goals to turn around. If they do, this could be the ice-dominating top-pair that the Blue Jackets haven’t had since, essentially, Zach Werenski’s rookie season.
If Denton Mateychuk can’t scale up his offensive contributions, though, it might be best for the Blue Jackets to experiment with Severson alongside Ivan Provorov as a way to spread the love across the middle six.
Then, there’s the Erik Gudbranson of it all too. He has, to Bowness’ credit, put up some good penalty killing actual goals and underlying performances, but his 5v5 play has been outright ghoulish. That’s a difficult torch to bear for any partner or forward line and certainly might not help the team protect leads just the same.