Comparing Shot/Pass Performance to Evolving-Hockey's Expected Goals

Having covered the preliminary data of shot type, pass type and offensive situation performance, we can take the “next” step and attach an expected goals models to the same shots and see what we find.
Because their PxP scraper made it easy, and they published predicted goal values for each shot, I attached every manually tracked game-sheet to their expected goals model. Conceptually, they have also therein offered my tools to build by own expected goals model (with shot location and a bevy of other important variables) but that won’t happen for a bit. I’ll talk more about what diving into their model might teach us about variables that lead to scoring, and the implications of then incorporating passing, but we’ll get there after we look at the data.


Considering Expected Goals
By incorporating an expected goals model, we make some of the visualizing easier by bundling some of the important data down into one number. At the same time, we are also losing some information relative to the rest of the tracking data, namely the location of shots that were blocked. As such, the following data will only be made with “Fenwick” or unblocked shots rather than the full complement of shots/passes that were blocked.
Before I get into the data, I think it’s important to seed some information. We are evaluating differences in outcomes relative to an expected goals model. It makes sense to do this for a couple of dimension-reduction reasons but also because we know that the NHL does not provide passing or situation related information. Conceptually, incorporating this passing data gives us access to pre-shot information that the xG model does not have. Therefore, it’s a good way to determine what the “value of a pass” or “a shot off the rush” is relative to purely the factors considered by what the NHL provides us.
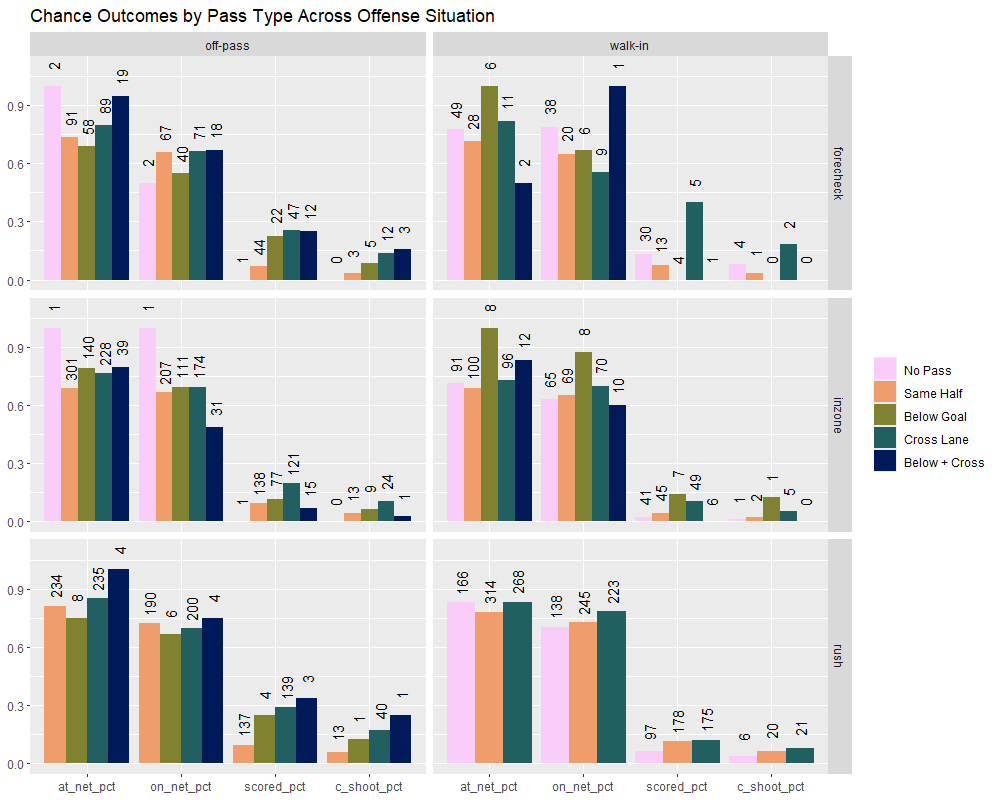
When seeing certain results, be careful in interpreting xG underperformance as “bad shots” or as “not valuable”. Whether a shot type or not is valuable has more to do with actual performance of said shot and that information has been covered, I have attached the chart above as a quick reminder of some of these values. If an xG model was trained with this passing data, we would likely be looking at a bunch of values much closer to 0.
After these plots, I’ll get more into the details about how/why we see certain results relative to this expected goals model and what it might mean for making a new one.
Shot Type Breakdown
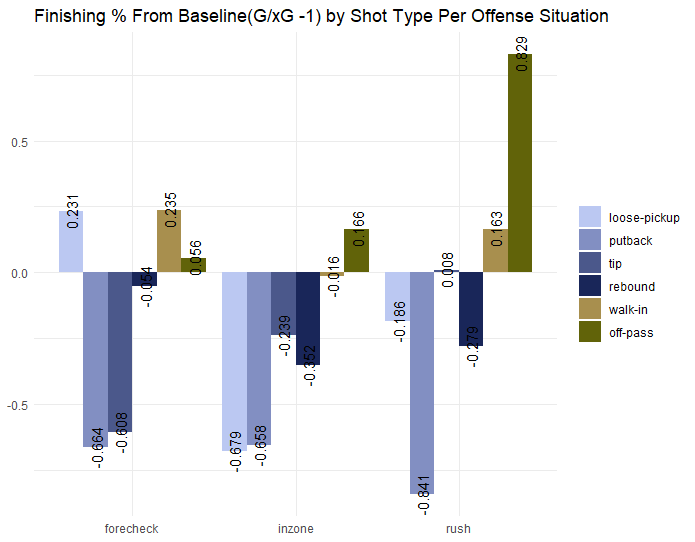
The plot should look somewhat familiar but given that I put limited effort into the axis and number details, perhaps it merits some explanation.
In this case, we are examining “finishing” which we get by dividing actual goals from expected goals. In order to make the plot more interpretable, I have subtracted 1 from the finishing value. A value of 1, or 100% in terms of percentage, means that we observed the same number of actual goals as the expected goals would have predicted. By subtracting 1, I have set the y-axis in a way that makes it very easy to interpret. The actual numbers you see annotated on the bars are then the percentage above “even”.
The most significant difference comes from off-pass rush shots. We’ve seen this borne out in the actual finishing data where this specific type of shot is scored at an obscene rate. There is simply so much information contained in getting rush-shots off-pass.
The greater observation, perhaps, is the continual underperformance of xG of net-front shot types in every situation. While putbacks have been considerably poor in all instances of shot danger measurement, and relative to xG that would have been expected, it’s perhaps surprising that rebounds and tips also underperformed their xG across all of their more significant samples.
Considering this data is heavily weighted by the Blue Jackets who had some great rush/counterattack sequences with Zach Werenski, Charlie Coyle, Kirill Marchenko, Mason Marchment and Adam Fantilli, and plenty of net-front action coming from Jenner, Voronkov, Olivier, Monahan and Coyle perhaps there’s some measure of influence there as well. Let’s also consider the Merzlikins and Greaves of it all.
It’s impossible to rule out that there are some team effects but will also be important to understand that some of our xG values (especially xP1) from the game breakdowns throughout the year m
Pass Type Breakdown
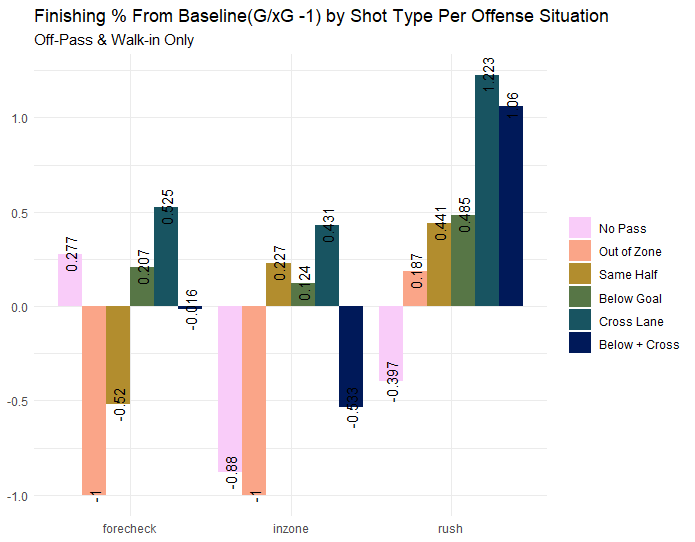
To look into the purest value of a pass, we must only consider plays that we know came from actual passes. Thus, this first plot considers only those passes. In it, we see echoes of plenty of the previous data.
Rush shots from any type of pass are fantastic but cross-lane passes of any variety remain king.
What is important to note here is that, despite same-side shots seeing ‘poorer’ finishing performance in some of the pure shot-outcome breakdowns they still scored better than predicted via expected goals in all but forecheck situations. That is partially explained by their tendency to be blocked more than other types, which is considered in my previous data and not via the expected goals, but should still be considered when we think about these values relative to in-game.
Players who create a lot of their xP1 off the rush, and especially xA1, are likely to score more actual goals/points than players who do so via net-front chaos.
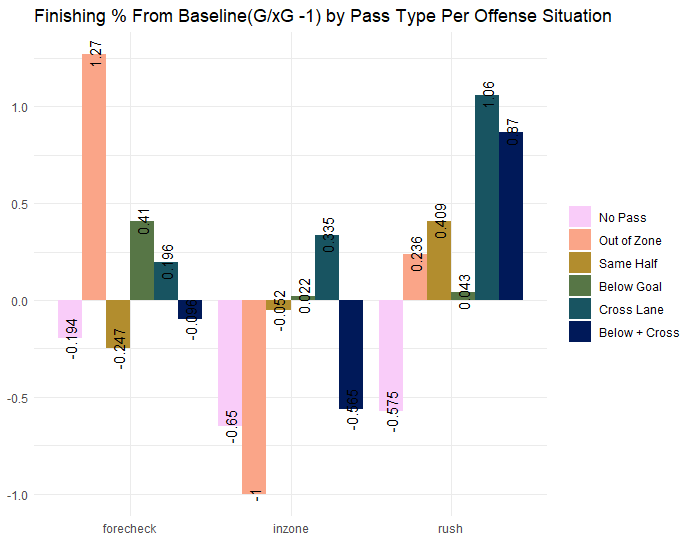
Allowing shots that come from “setups” that might not necessarily be passes, depending on your definition, changes the values a little bit. The primary culprits here will be “tips” but takeaways that moved the puck across the median or from below the goal-line to above are the more voluminous influences.
Here, forecheck and in-zone offense look a little different but the grander conclusions still hold.
Lessons from Evolving-Hockey xG Model
I think now we get to the point where we can’t avoid addressing the actual components and issues with Evolving-Hockey’s expected goals model.
We’ll start with the big concern: across plenty of metrics, the EH xG model was one of the worst performing among public models this past season. Why? Well, likely because this model was made in 2018 and the NHL has incorporated puck and player tracking into their PxP data.
Among plenty of other things, this changed the actual locations of plenty of tracked shots and their outcomes. That we have removed some of the human tracker bias, especially with respect to shots very close to the net, has had some very profound knock-on changes to models that haven’t adapted to the changes. HockeyViz, for example, heavily weights more recent seasons which means many of the human-biased shot outcome values have fell off in terms of weight.
Perhaps, should the EH xG model be trimmed of training data that has more accurate shot-location values we would see some improvement in predictive value of tips/rebounds. Then again, maybe not.
It’s also quite possible that the EH model relies on certain other factors that my binning simply did not. Closer inspection might reveal different differences between actual and expected by way of angle-change between initial shot and rebound but most commonly what I would expect to be the impact of takeaways/giveaways/hits in the defensive zone as they are translated directly to shots.
Instead of stopping here, let’s get into the paramaters that EH uses for their model. You can read their entire write-up here.
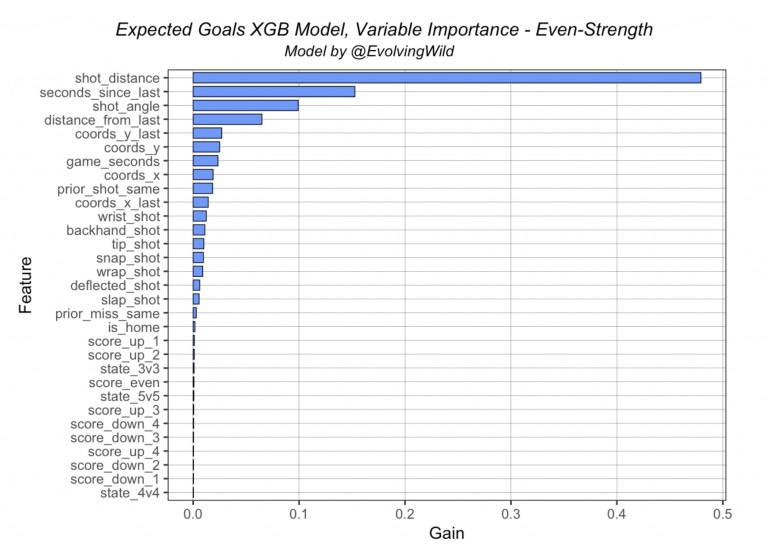
Evolving-Hockey uses an XGBoost derived model. I will not pretend to be an expert here and have had to do some cursory research to even explain what some of the above plot means.
The easiest conclusions to make are probably safe. The longest bars are the parameters, or factors influencing prediction, that were the most “important”. That last word is a bit sticky but we can at least say that including shot-distance in their model reduced goal prediction error the most. Assuming shot_distance gain translates to “accounts for approximately 50% of prediction outcomes” is something I’m not sure is accurate.
The other factors are also important though we get less information on how we would expect each to impact this specific shot. Seconds since last event, distance from last event, and plenty of the other “last event” paramaters appear to be in the next tier of importance. These are, at least generally, the likely “value promoting” factors of rebounds.
For example, if a shot is on net and the next shot comes a mere second after we can then presume it was boosted in value by being close-in-occurence to the last recent event. If the angle change or distance from that event is also high, then presumably that was more dangerous though this plot doesn’t make particular directional claims. Furthering the example, a rebound that is taken on the opposite side of the initial save would be more dangerous than a rebound that comes from the same direction as the initial save.
What I’d like to postulate is that it’s possible that a defensive zone hit/takeaway/giveaway that is turned into an immediate shot (aka a forecheck shot) already has it’s value boosted by being near-in-occurance to the shot. The parameter for seconds_since_last would have a large influence and that might explain why actual goals were predicted better for forecheck shots than for rush shots.
Similarly, that might explain plenty of the “rush” shots outperform the expected goals. The Evolving-Hockey model tries to ascertain rush shots by way of time-since-last event, such as a takeaway/hit/giveaway, outside of the offensive zone.
So far, each model described has used logistic regression to predict goal probability. Peter Tanner – creator of Moneypuck.com – employed gradient boosting (GBM) instead of logistic regression and added a “flurry adjustment” to offset excess value gained from rebound shots. Additionally, rather than using rebound and rush shot classifiers, he used prior event variables in his model. His use of a gradient boosting algorithm and prior event variables was something we drew heavily on when creating our own model. You can read more about his process here.
This is a good process that moves away from qualitative classification but might be actively harmed by the lack of data inputs in the NHL PxP.
Aaron Knodell has already wrestled well with this problem and my qualitative tracking only corroborates Corey Sznajders’, at least at a cursory glance. The Blue Jackets bias in my data cannot be ignored but without a healthy stable of game-trackers that’s not something we will be able to contend with in any short time period.
Pre-Shot Parameters for Passing-Weighted xG Models
When considering how passing influences the likelihood of a goal being scored, or of it outperforming location-based judgements of likelihood, I believe a couple of the above parameters already give us a good non-qualitative way to start building out ideas.
Essentially, current xG models are blind to actual time-since-last event. The above model incorporates the time since the actual last event in only rare cases, rebounds the only near-guaranteed, and having passing data would likely obliterate the validity of this parameter as currently trained.
Consider something like a cross-lane pass into a one-timer. Seconds-since-last, depending on pass speed, would be shorter than the time elapsed between a shot and a rebound. The distance from last would be significant as well.
As Darryl Belfry suggested when designing his offense, we should work back from the goaltender. The goal of any offense is to shoot where the goaltender is not. Of course, there are always places the goaltender is not considering their bodies do not consume the net but we can always increase the likelihood by exploiting their angles and movability on account of being on ice-skates.
A shot that traverses the ice sheet in front of them quickly and gets to the net quickly is the most dangerous possible outcome (maybe). Instead of being forced into “shot bins” and “pass types” we could summarize it all in one with a sort of angular velocity type metric. Angle + distance of initial pass location, angle + distance of final shooting location, modulated by the time the pass travels, the time from pass reception to shooting and the time from the shot to the goal line. If we assume average traversal times for each pass and shot, perhaps we can then also get a good idea of who are great passers and shooters.
The “change over time” part is quite critical, at least I would guess, in part because it means the shorter distances of passes closer to the net are conceptually more dangerous. Given the “angle” a pass across the crease would conceptually result in the same “angle change” as a d-to-d point shot. Perhaps that is already accounted for by final shot distance but I think these things would be interesting to study.
I could conceive of “shot optionality” or “threat” resulting in even better finishing. A pass on the extreme angle, even if it is backdoor, only has a “beat the goaltender on the right/left side option” whereas middle shots allow both options at least conceptually. Maybe, then, a pass from a heavily optioned space (say the middle of the ice between the dots) might then actual reduce a goalies’ capacity to move to a corresponding shot in a way that also outperforms conceptual angle changes.
There are some actual problems here, like determining time from reception to shot for anything that’s not a one-timer and assessing how to account for player motion after reception, and furthermore how to account for tips at all, but there are at least some valuable parameters already in current xG models to build from.
Perhaps these are things to be examined through the summer.
The Problem with Incorporating Players
Up to this point, we have examined general principles about what offense and or passing might mean relative to actual scoring. The difficulty of such tasks are only compounded by my tracking only shots for and against the Blue Jackets. While we like to think of The Blue Jackets as a team that is doing all of this, and perhaps coaching systems are a reason to, it must be said that these scoring/finishing outcomes are driven heavily by the players in the situation. There is a sort of up and down relationship that is nearly impossible to fully understand.
In any case, part of the exercise in quantifying passing outcomes was to help determine who are good players and especially those that help contribute to winning when it doesn’t appear in the boxscore. We know how many shots a player shoots every game, we have no information on players who don’t shoot but instead set up a bunch of the shots.
Micah McCurdy has done the best work in examining passing skill as it relates to contributing to wins via his creating of the “setting” metric. You can read about it here (and take a quick journey through changes in shot outcomes with tracking changes at the same time).
In any case, I now seek to illuminate some of the incredible difficulties in ascertaining “passing skill” and that even comes before accounting for “shooting skill” at the same time. Simply put, the sample sizes are quite small.
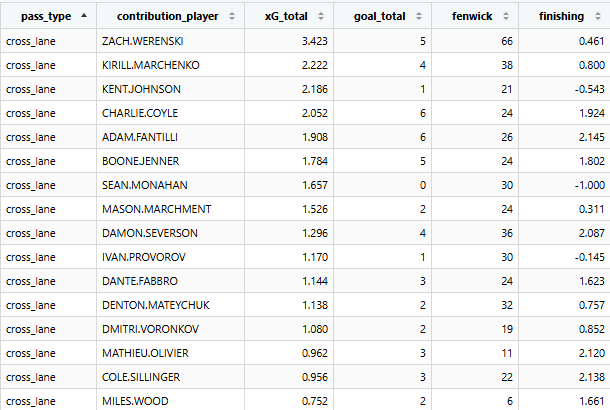
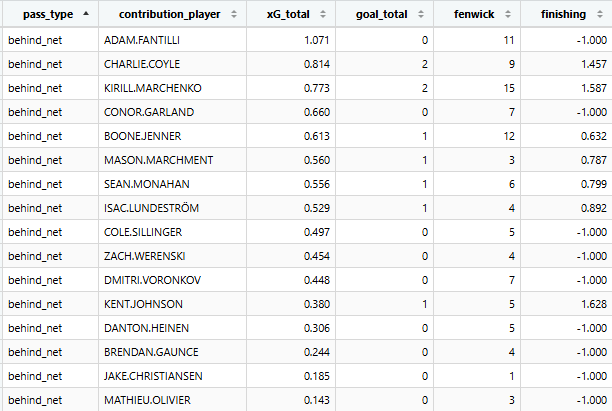
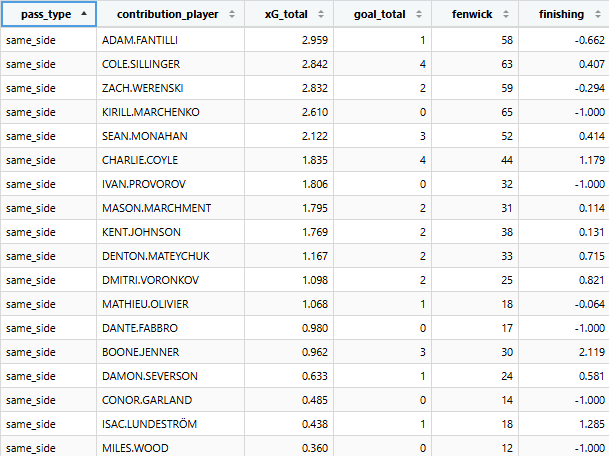
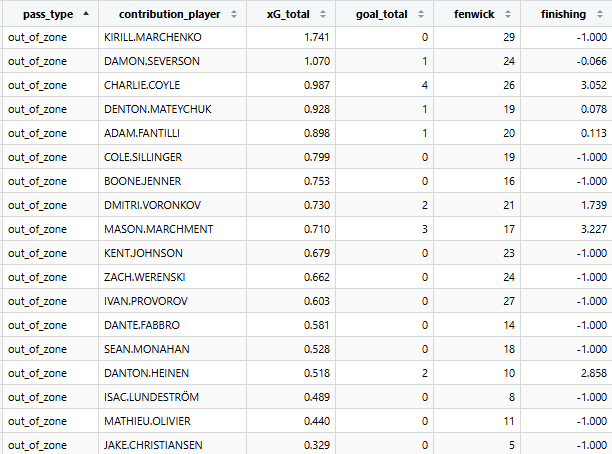
In order to illustrate these sample sizes, while also giving you insight into the types of passes and quality of playmakers of Blue Jackets players from the past season, I will simply use some screencaps of tables rather than fully formed visualizations.
The following data will include exclusively “off-pass” and “walk-in” shooting situations. In order to compare them to expected goals, I must also remove the blocked shots. Thought the above data is comprised mostly of outcomes driven by these players, consider that the average “controlled” offense shot outperforms expected goals considerably. Consider too that the average sh% of these types of shots on the season, at 5v5, was 9.28% (read as 0.0928 in the table).
Finishing is the same as above. Shot Danger and Predicted fenwick shooting % are the same metric (xG/F) and shooting percent is as you would guess (goals / shots on goal). The player in the “setup player” column is the player who passed and the shooting data will be exclusively recipients of their shots.
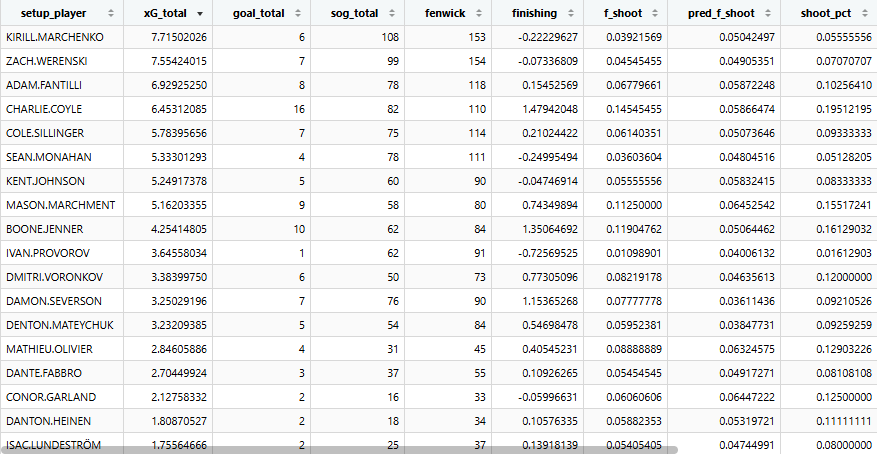
This is not a comprehensive list of all players and does not compare the opposition either. However, look at the total counts. These are not big samples.
Consider the following two players: Kirill Marchenko and his 5.56 received sh% and Charlie Coyle and his 19.5 received sh%. Of course, that helps explain Marchenko’s 6 primary assists and Coyle’s 16 but what can we learn from this situation? Is Charlie Coyle a better passer than Kirill Marchenko? By outcomes, you would have to assume he is quite dramatically better. Given what we know about shooting volatility, it’s easy enough to suggest that a 19 sh% is very unlikely to be repeated. If Marchenko’s recipients scored at the same rate is Coyle’s, he would’ve had something around 20 primary assists (14 additional) at 5v5.
Mason Marchment only played in 39 games for the Blue Jackets and yet outperformed high minute players like Boone Jenner, Ivan Provorov and Mathieu Olivier. He did so by setting up the highest average shot danger on the team with an expected fenwick shooting % of 6.03 %.
Boone Jenner had 10 primary assists at 5v5 from direct passing and yet he set up fewer chances, the average of which was less dangerous, than Kent Johnson who only had 5.
In any case, it remains clear that actual goal outcomes remain volatile and that individual xG or xA1 are ultimately unlikely to ever match specifically. Only in year-over-year sample sizes will we ever have hopes of ascertaining true pass-impact skill and even then it appears it might be entangled quite heavily in player shooting skill as well.
Additional Pass Value Tables
Like last breakdown, I will offer the following tables as extra information as a sort of addendum without extra commentary. Remember, these passes come from off-pass and walk-in situations only, the pass-type is listed in the left-most column.