
Preliminary Mapping from Tracking Project

One of the purposes of taking the time to track every shot down to the second, while associating it with passing and situational information, was to create a larger data set with some somewhat-unstudied information that could provide fuel for offseason analysis and projects. Given that the Blue Jackets are in a bit of a holding pattern, I figured now would be a good time to start the preliminary work.
There is plenty more work to be done here but as I get more into the specifics, I have come to realize that I need to continue diving deeper and building more to actually draw any plausible conclusions. Essentially, I’ll have to build out a model in order to most accurately incorporate the very many layers of offensive situation and passing information. That will take some extra time so instead I thought I would offer a series of examinations of said successive layers as a sort of analytic journey through impacts on shooting and scoring.
All Shots and General Location Overview
In the coming plots all data will be from the tracking project and associated with the NHL PxP data. As such, they will only be from games played by and against the Columbus Blue Jackets. That’s not a good sample for generalization most likely but that’s not something to be solved today. While I will not be looking into expected goals today, we can certainly compare outcomes to Evolving-Hockey’s expected goals model at some point in the future. Additionally, I will only be looking at shots from 5v5.
I stuck with NHL PxP as much as I could but there are certain shots that I disagree with, especially those made from outside of the offensive zone. Whether from error or disagreement, I have a difference of near 400 total corsi (7631 total vs 8030 from NaturalStatTrick) which amounts to around 5 per game.
Binning is bad and you shouldn’t do it. Really, all shot and location based information is continuous and any attempts at discretization are going to skew analysis. Unfortunately, I am a human with only limited time. Considering I had a desire to incorporate location based information for blocks (which are recorded as the place they were blocked and not where they were shot from) as well as the location of passes I had to compromise. While I didn’t have great reasoning about the formation of bins, I chose instead to keep it about as simple as possible and instead steal the basic shape of NHL Edge data with a mid-line divider in place of pure middle-bins.
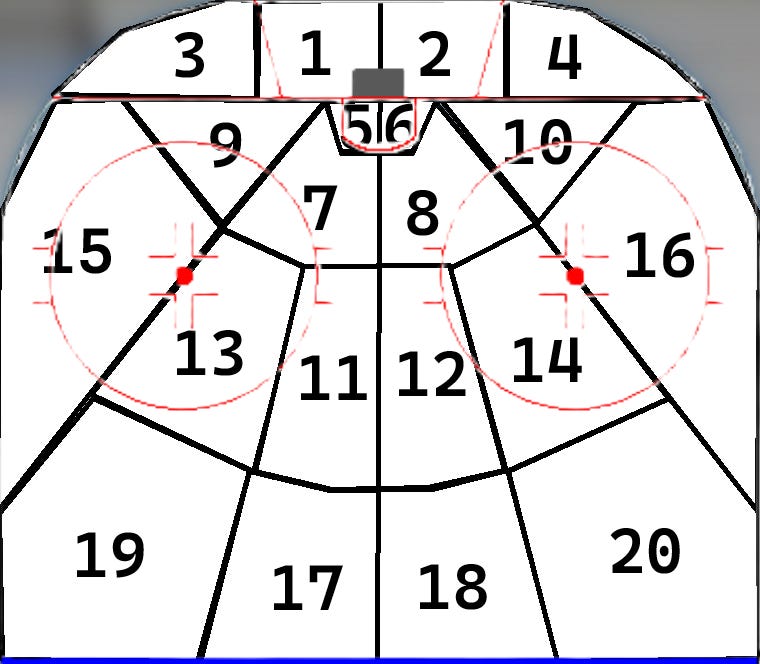
As such I chose to utilize some location binning inside the offensive zone (as well as a bin each for passes from the neutral and defensive zones). I have also removed all shots from outside of the offensive zone as I think incorporating them into shooting percentages or even corsi shares feels antithetical to their purpose as measures.
While I hoped to, eventually, simply make this map automatic, I realized then that I would still be required to record ultimate shot location bins or else relinquish “block” shot locations from the exercise.
So, the first and highest level takeaways will be to split shot outcomes down the outcome tree, from blocked → missed → on-goal → scored, by way of each separate bin. To keep it high level, though, I’ll bin these bins once again into more commonly understood buckets: chances and perimeter shots. In this case, a chance is any shot (definitionally even ones that were blocked and perhaps more commonly referred to as “shot attempts”) from bins 5 through 14. I do not like the editorialization of referring to them as “chances” but it’s simply easier to accept, and a good goal to work towards, than writing “interior” or “perimeter” shots as I have done previously.
By remaining at this top level, and by making this very simple space-bin only distinction, we’re introducing plenty of error. In some cases a shot from the “15” bin is actually certainly a dangerous shot but let us take a journey through numbers before we get to attempting to prove the feelings we have developed by watching hockey for so long.
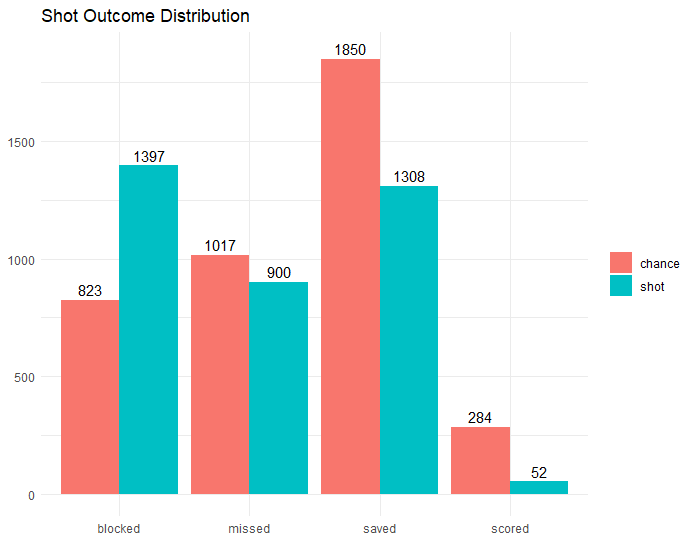
All shots for and against the Blue Jackets amounted to this plot sorted by outcome. The location binning certainly helps illustrate the most primary principle but this is mostly a poor graph for plenty of reasons. We’ll fix it up shortly.
The first, and easiest, takeaways: perimeter shots are blocked quite often and interior shots make up the vast majority of goals.
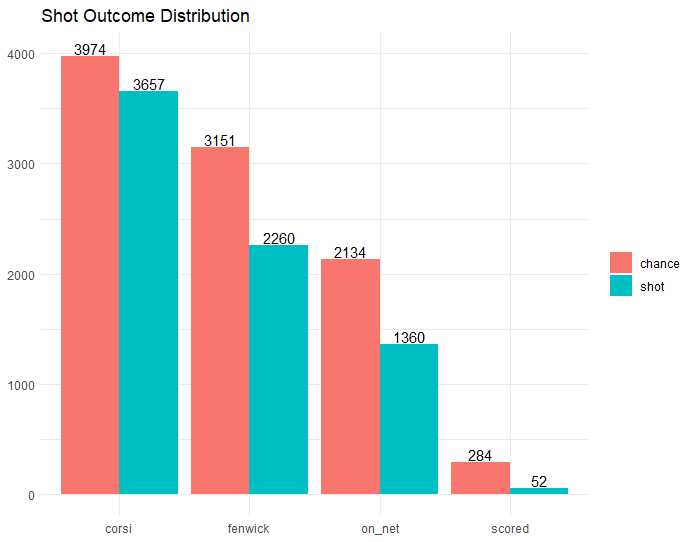
By combining the outcomes together into familiar bins that include everything else that comes after, we can at least get a better idea of the totals. The biggest takeaway is simply that there were more shots in the interior than there were perimeter shots.
That was mildly suprising to me and, perhaps, might have come from the “analytics revolution” as teams have made specific efforts to shoot better shots.
I will admit though, that it’s entirely possible it comes from some sort of tracking bias at the same time. If a shot was near an interior bin, I was likely to grade it as a chance. The absurdity of definitive lines such as they are, a foot away from the middle bin feels more like the middle bin than a shot from distinctly the wall. In very many cases, shots almost seemed designed to come from the perimeter of the “homeplate” area. I assume that the defense uses the ice-geometry, which forms the homeplate, and these gray-area shots are simply a product of avoiding that direct pressure.
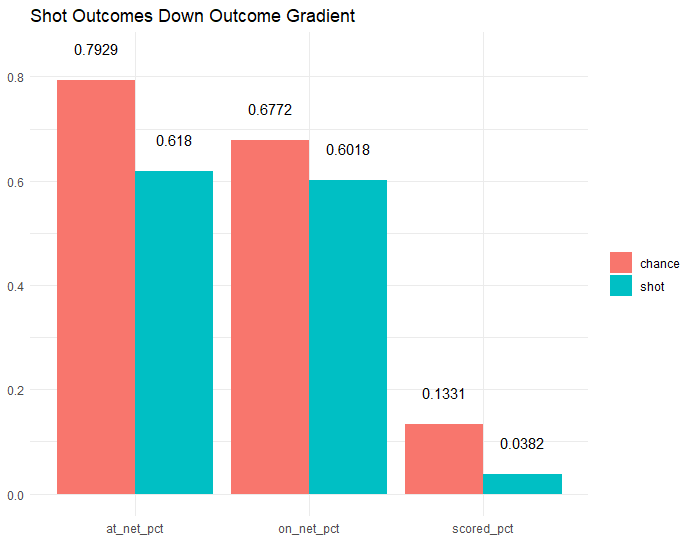
As we examined when looking at goaltenders, the most accurate way to ascertain the “finishing quality” of a given shot attempt is to evaluate how it performs across a successive likelihood of scoring. By looking at the percentage of shots that “proceeded” to the next step, and eliminating ones that did not make it to that point, we have a better understanding of how each layer is impacted.
In essence, the above charts made it difficult to understand if there were fewer perimeter goals because so many were blocked or if they were actually more difficult to get in the net. By distilling it down this way we can see that interior shots are more likely to succeed at every step. Any given chance is more likely to be “unblocked” (at-net) any given “unblocked” chance is more likely to be “unmissed” (on-net) and any given “unmissed” chance is more likely to be “unsaved” (scored) than each corresponding perimeter shot. They’re just better all around.
I have not decided to proceed so far as frozen and rebounded, as I did with goaltenders, but perhaps there’s more time to examine that frontier later.
The quick takeaway feels obvious, chances are better than perimeter shots, but the specifics of percentages are important. 13% of chances that required a save were not whereas only approximately 4% of perimeter shots were the same.
While they aren’t plotted here, these also have implications for the “corsi shooting percentage” of both. If you’ve spent plenty of time looking through stats or expected goals models, you might know that “fenwick shooting percentage” is the share of unblocked shots that are ultimately scored and these can be used as a better judgement of player results (or luck or finishing) than purely on-goal shooting percentage.
I will not make another plot, as they are technically reproducible from the second plot above, but for the purpose of providing the numbers: chance corsi shooting percentage (at 5v5) was 7.15% and perimeter shot corsi shooting percentage was 1.42%. These then represent the big picture “average chance/shot” by which we can compare all other types/situations.
Offense Situation Overview
We, or maybe the hockey media, spend a very significant amount of time talking about rush shots and creating rush chances. Some of the earliest research in hockey, and some of the continued most reliable predictors of individual performance, come from data specifically surround controlled entries. Look at the AllThreeZones charts and the top of the league is filled with players who are generally regarded as the absolute best: Connor McDavid, Nathan MacKinnon, Jack Hughes, Jack Eichel and even now among defensemen with Zach Werenski, Quinn Hughes and Roman Josi.
At the same time, the Florida Panthers won a Stanley Cup on the back of their forecheck. Maybe, then, rush offense isn’t quite as important and maybe merely tactical preference. In any case, the more major question is are rush (or forecheck) shots more valuable than other sorts of shots?
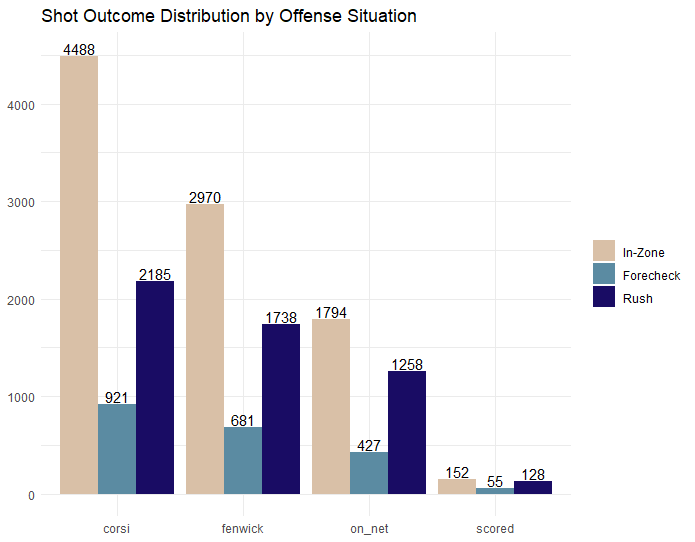
A key point of observation, inzone shots make up the vast majority of all shots. 4488 shots vs 3100 between rush and forecheck combined for a total of 59% of all shots. At the same time, it does not have a corresponding share of the total goals having only 152 vs 183 rush and forecheck combined (45% of all goals).
Shots directly from forecheck turnovers are by far the least numerous. Perhaps there’s more to be said about controlled entries vs forechecks relative to shot efficiency, or perhaps there’s a defensive or “event-temperature” tradeoff, but at least by my own definitions these types of shots are the most rare in general.
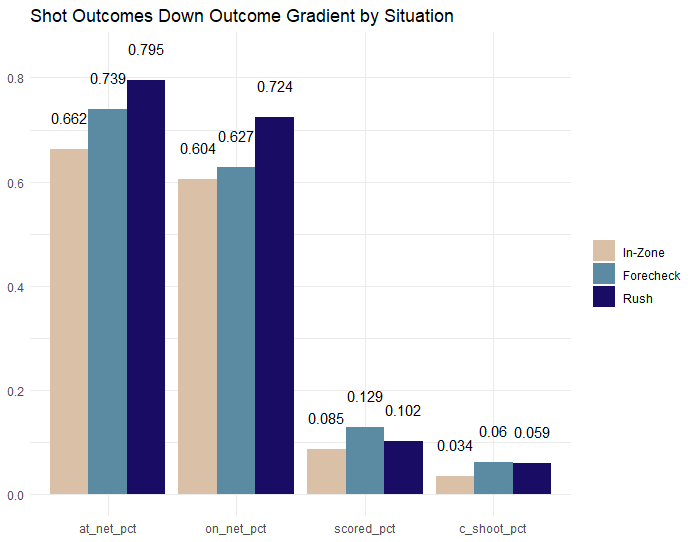
When it comes to pure outcomes, the results are somewhat interesting. Any give rush shot is far more likely to get on-net (and not be blocked) than shots from other situations. Of shots that get on net though, they are not scored at a greater rate than those on the forecheck
Inzone, across every measure, are the “worst” type of shot. There’s plenty of sense here and that’s probably by definition. The reason we care about he other two kinds of offense are because they are more indicative of broken defenses and therefore could specify “better” offense than location would tell us.
The Columbus Blue Jackets and teams that played against the Columbus Blue Jackets scored most efficiently, of shots on net, on the forecheck. Hard to say exactly why but something to keep in mind.
The actual scored percentage (which is colloquially known as shooting percentage) might be a little misleading relative to the actual “danger” of any given shot attempt. Using the information above we can incorporate the likelihood of being on net, and unblocked, by using corsi shooting percentage.
Rush: 5.9 corsi shooting %
Forecheck: 5.98 corsi shooting %
Inzone: 3.38 corsi shooting %
Because forecheck shots seem to be scored so well, any given shot is equal to a rush shot. Inzone is markedly worse.
Obviously, there might be some factors that complicate the above information (like distance from net) that mean we might need to dive a bit deeper before drawing any takeaways here at all. Given that I binned all shots together above, we might as well do that now.
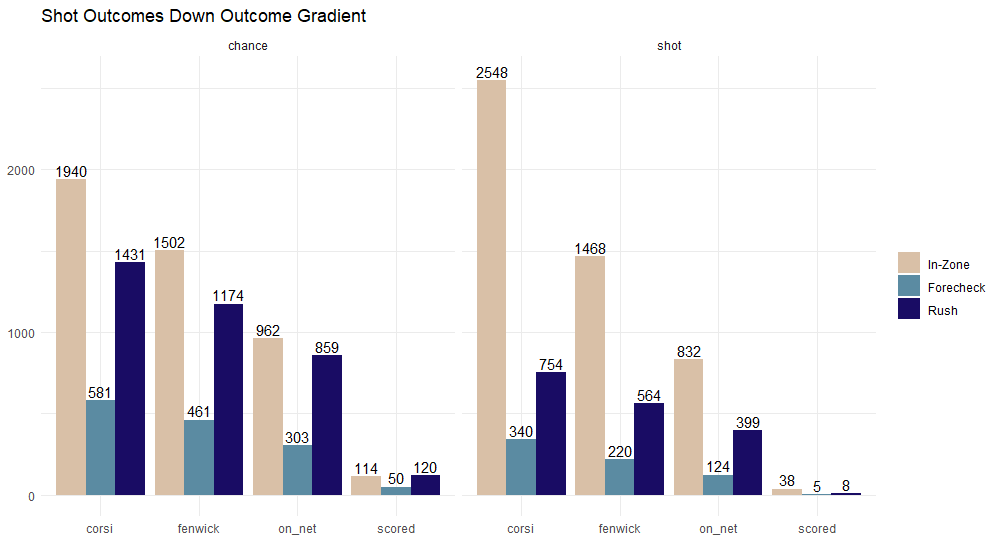
A far greater percentage of in-zone shots come from the perimeter than any other situation. I don’t even think I need to express them as ratios because of how distinct the visual is. Both rush and forecheck have more “chances” than they do perimeter shots.
Corsi Shooting%:
Rush Chance: 8.39 %
Rush Shot: 1.06 %
Forecheck Chance: 8.61 %
Forecheck Shot: 1.47 %
Inzone Chance: 5.88 %
Inzone Shot: 1.49 %
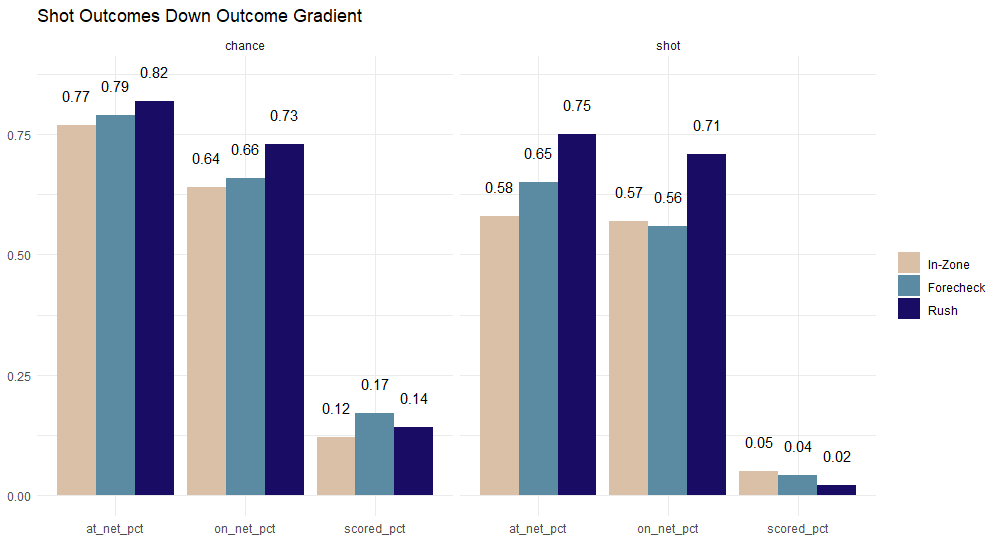
Looking down the gradient and we continue to pull some of the same information. Rush shots continue to get onto the net significantly more than other situations but forecheck chances are scored at a much greater degree.
The only interesting information, perhaps, is the lack of scoring of distant rush shots. I presume this perhaps illustrates the benefit of net-front traffic. Both forecheck and in-zone, though neither is guaranteed, is more likely to have another player in-front of the goal.
As far as chances go, from the holistic view, rush and forecheck tend to grade out about the same. Rush chances are unblocked and on-net more but forecheck are scored more in a way that has them about the same in regards to holistic scoring. If there are other side benefits/tradeoffs to the on-net and un-blockedness of rush chances, then we might be able to tilt the “holistic” value of certain shots in one direction or the other.
Shot Type Overview
The last bit of unique information provided by the tracking project was the unique selection of shot types in a way that is designed to complement the nature of passing but might also help us understand differences in tactics and shot values across these sorts of situations.
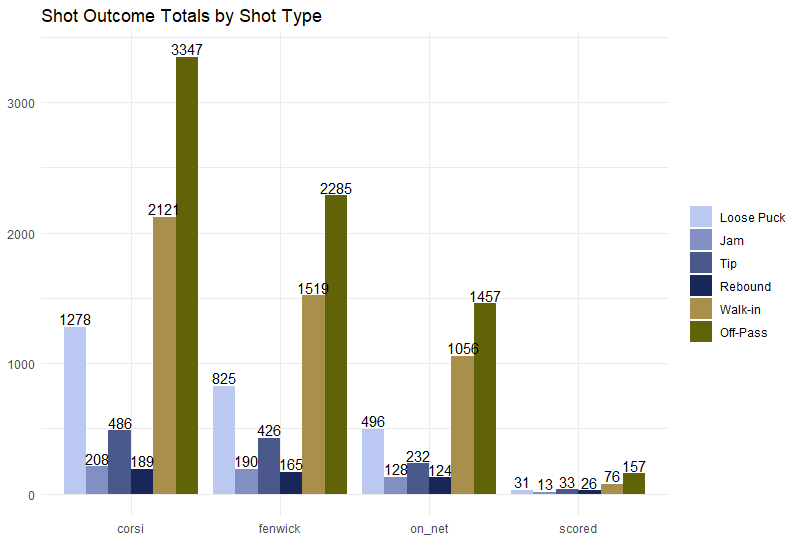
The rather large and easy takeaway is that the vast majority of shots come from off-pass situations. In fact, controlled offense makes up a significant majority. Even loose-puck, though it is often uncontrolled, stands as something a little bit different than the pure net-front options like tips, rebounds and jams.
The scale, as usual, makes things difficult to comprehend at this level. Still, the base numbers are important. As we’ll see, quick quality binning really helps tell that story.
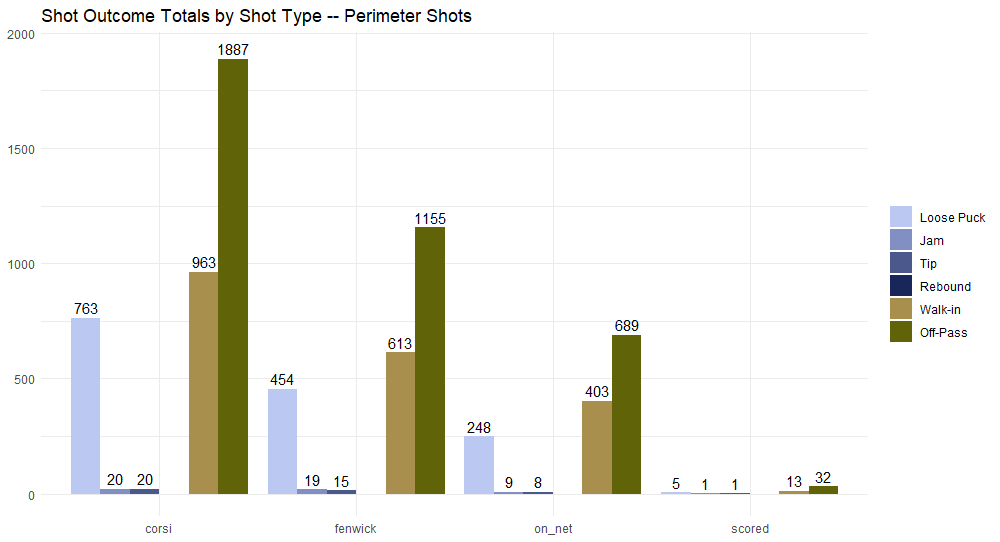
The perimeter shots really help elucidate why controlled types of offense are so prevalent relative to the entirety of shots. As you would expect, jams and tips hardly exist. There are no recorded rebounds from outside of the interior of the ice.
How can rebounds be nonexistent but putbacks exist? Generally, these come from shots taken behind the net. Given that there is no direct route from behind the net and into the goal, it seems impossible that these should be considered direct rebound chances.
You’ll also notice that this is more than half of all off-pass and loose-puck shots, though less than half of walk-ins. Most point shots come directly from passes, either a D to D or even just up the wall. Similarly, perimeter loose-puck shots often come from rebounds or saves that are splayed out onto the walls, or even forecheck turnovers that are shot from the wall/point rather than being turned into anything different.
As we’d expect, not many goals of really any variety from perimeter shots.
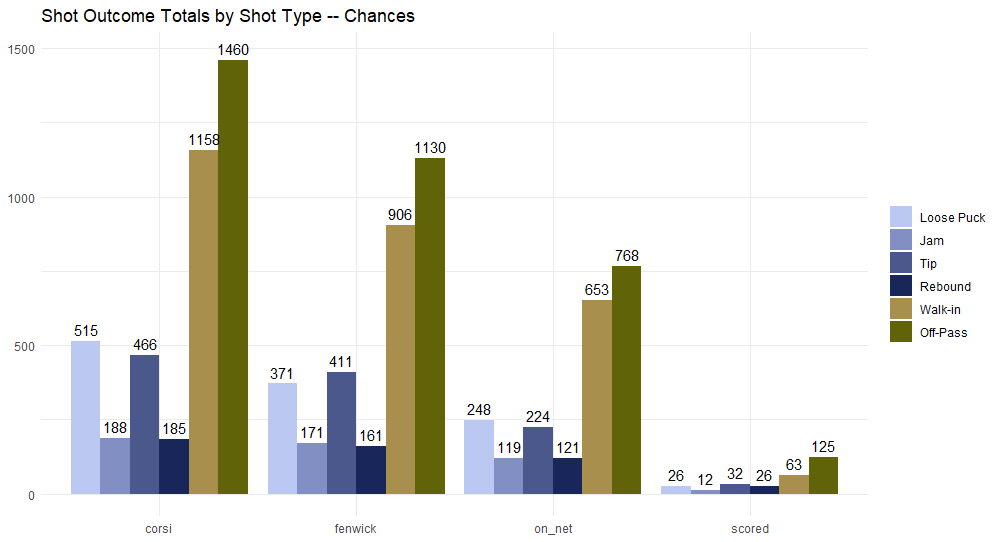
When it comes to chances, we see significantly more representation from the other shot types. Walk-in shots are taken far more often in the interior than they are outside of it. Not too much to learn from that fact, though it does suggest that a player will move forward to upgrade shots or otherwise probably just shoot from where they are.
At this point, I think any real conclusions will simply happen on the scoring and performance front. Splitting these two by outcomes just goes to show that a type of shot might not have inherent value if we consider low-leverage perimeter shots.
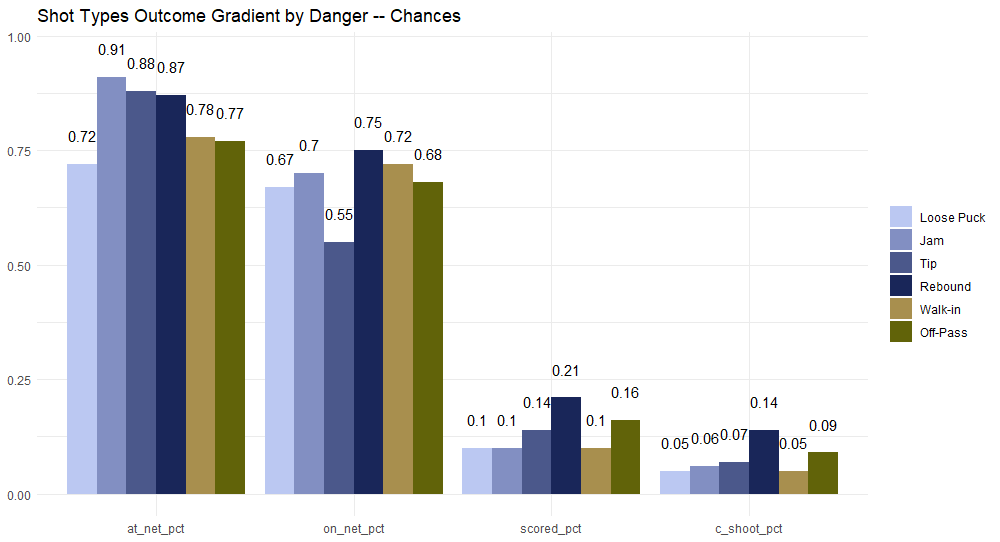
When we look at performance of shot types as it relates to the aspects of finishing, we get some expected and unexpected result. The last grouping, c_shoot_pct, is the corsi shooting percentage. Not derived necessarily from the information that the rest of the plot is but important when considering the gestalt.
A couple of quick observations. The primary net-front trio are all unblocked extremely well. These might be something of an ontological problem or, perhaps, feature. I am not sure how to tackle this problem exactly but the nature of these shots being mostly so close to the net mean that they are unlikely to be recorded as anything other than a miss. If a tip is “blocked”, especially near the crease, it is simply not a tip but a block. If a tip is missed, it is a shot from distance that is miss, unless it is, of course, a successful tip that doesn’t make it on net which is something that happens extremely often.
Similarly, there are few options for being blocked when we consider that there is nothing between a rebound and the net than a goaltender. Obviously, that closeness is a significant point of their value but also maybe violates some of the principles of then beating a defense. I have attempted to combat these issues by separating rebounds (which have some sort of impact applied to them) from putbacks (which are simply stick on puck actions without any discernable intention). I am not sure these judgements make sense but we can still combine them if we dislike the separation.
If we combine rebounds and putbacks, the ultimate corsi shooting % comes down to 10.2% which makes them still the most dangerous shot but only marginally moreso than off-pass. This is, of course, prior to accounting for anything like location or angle change.
The top level consideration is that off-pass chances are highly preferable to anything else. Considering there is a level of pre-shot movement that is required, by definition, that makes a ton of sense but is nice when comparing it to other chances explicitly.
Walk-in chances, though, are among the least dangerous. Perhaps there’s more to be seen with greater detail but that definitely suggests that finding passing solutions is highly preferable to shooting off of extended carries.
Tips serve as something of a shortcut. I have problems with the nature of tracking making it difficult to accurately value these shots but it’s clear that, despite their high miss rate, they are still dangerous shots and any that connects should certainly count as a “scoring chance”.
I did not expect loose-puck chances to be the least effective. In this area of the ice these could be direct takeaways converted into shots, pseudo-rebounds that come from blocks or missed shots but that never made it to the goaltender, or any other time of random loose puck via completely deflected pass or more distant rebound or otherwise. While the color indicated a less dangerous shot type, I didn’t have any qualitative reason to believe that these types of shots in the interior would actually be of lower quality.
Quick Takeaways
Alright! So there are a couple of fun “conclusions” that we can draw straight away.
Rush shots are more valuable, at least partially, because they are much easier to get on net. We can assume that has something to do with control of the puck and movement relative to defensive pressure and organization. Any time you see a team with a high number of rush shots, you’re most likely seeing a team that is also shooting from closer and getting shots more on net.
While I won’t get to this depth any time soon, there is more to be said about how these shots work, or my definition of “rush” works, in relation to some of the attempts at categorizing “rush shots” from pure PxP data.
As far as the Florida Panthers go, perhaps creating a system of outrageous forechecking does have some merit. While chances from the forecheck were the least numerous they were quite dangerous all around. Perhaps there are some CBJ system aspects here or perhaps we’ll simply find out that the chances tend to be very close and there’s nothing inherently dangerous about the moments just after a defensive zone turnover.
From a similar perspective, shots from the interior that come off of a pass are also highly valuable. Are these related points of information? Probably. That’s the sort of thing we’ll keep peeling away as we move down layers and look for interactions between offensive situation, distance from net and even shot type.
Rebounds, as ever, are quite dangerous. Even when including the “low quality” they still grade out as one of the most likely to score chances. Will this hold up when we include distance information from other types of shooting? Hopefully we’ll find out.