
Diving Deeper into Shot and Pass Data
Offensive Situation and Shot Type Interactions, Passing Data Effects on Scoring Threat

And so we return from a brief break, though a spontaneous long weekend in Chicago makes the break longer than I anticipated, and continue to dive into some surface level examinations of data form the tracking project. Last time, we took a look at the highest possible viewpoint for a variety of shot classifications. There wasn’t too much to learn but we should at least have some very preliminary benchmarks when it comes to splitting down values further. We understand the shape of the data a little better.
In order to move forward in our understanding of the tradeoffs of certain shots or styles over the other, we must continue to examine interactions and relationships between the variables that we understand. Let’s start with the three overviews before drilling down deeper.

Corsi Shooting Percentage
Using a single number isn’t necessarily the best way to represent the multi-faceted nature of shots in the NHL. Unfortunately, an outcome matrix is difficult to understand. For ease of explanation, I’ll likely stick with corsi-shooting-percentage as the catch all.
The average shot (including those that are blocked), at 5v5, that came for or against the Blue Jackets this past season was scored 4.4% of the time. We’ll call this 4.4 cS%.
The, perhaps, single most important aspect of calculating the likelihood of scoring remains distance to the net. By filtering out some very unlikely to be scored shots we can get directly to the meat and talk more about “chances”, you can find that information in the previous breakdown. The average interior chance had a 7.15 cS%.
In order to continue down our investigation track we can evaluate that cS% across the variety of more-or-less subjective shot types and offensive situations.
Offensive Situation:
Rush - 8.39 cS%
Forecheck 8.61 cS%
Inzone 5.88 cS%
Shot Type:
Loose Puck 5.05 cS%
Putback 6.38 cS%
Tip 6.87 cS%
Rebound 14.05 cS%
Walk-in 5.44 cS%
Off-Pass 8.56 cS%
Following from these basic “averages” we must wonder how they interact with eachother. Is an off-pass situation the same across the offensive situations? Are rush shots more dangerous simply because they come off-pass more often? Are we still flying blind because of location binning? Are we tricking ourselves with implied pre-shot movement without taking it a step further?
Offensive Situation x Shot Type
Most recently, we discovered that certain types of offense are comprised by a greater proportion of chances than perimeter shots. Not only did rush and forecheck offense often create bigger chances, by way of closeness, but they also outperformed in-zone chances at every level of shot-scoring quality.
The next question, then, is why? Or better put, are these difference explained by information we already have? If rebounds and off-pass chances are scored at a greater rate, could it be that forecheck and rush chances are simply more likely to be rebound and off-pass?
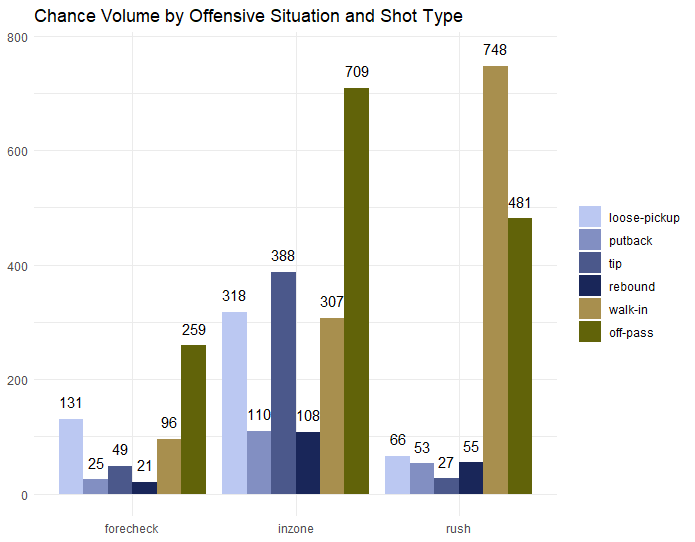
In order to make some of the visualization easier, I have decided to strip away perimeter shots. I believe these shots have some sort of value, especially as efficiency and surrounding information goes, but considering their diminished likelihood to become a goal I think it’s fair to look for better information in the critical areas of the ice. We already know that rush and forecheck chances are better because the defense has been solved enough that there are more chances but we must also find why even the chances are better.
The character of each offensive situations begins to take shape. Rush chances are almost entirely walk-in or off-pass. It makes easy logical sense there. Similarly, there are many more tips from in-zone situations. Forecheck looks similar to in-zone albeit with fewer tips and what looks like more loose-puck attempts.
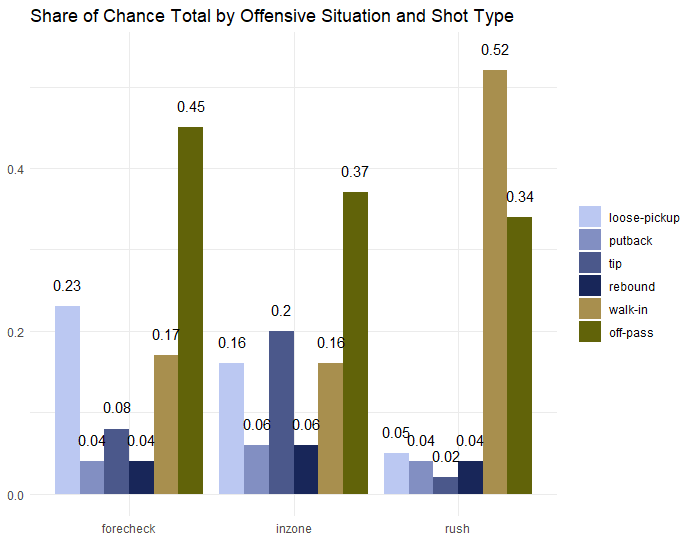
By plotting shares instead of raw totals we can indeed see the similarity in shot-generation styles between inzone and forecheck offense. Forecheck have more shots coming off of the pass, through loose pucks and fewer at the net-front but they are far more similar to eachother than rush offense.
Rush offense has a frightening majority of shots coming from walk-in sources. I suppose it’s more like a frightening plurality and somewhat normal majority if you’re a pedant but I think you understand either way. This might have some major implications on decisionmaking but is quite logical when you consider the nature of a rush shot. Any pass near the top of the zone, or outside the zone and carried in or even carried to really any significant degree, will as such be tracked as a walk-in chance. Perhaps later we’ll find that the capacity to finish on these extended carries while manipulating the goalie is it’s own skill or perhaps it’s good rush players who make sure to find passes anyway.
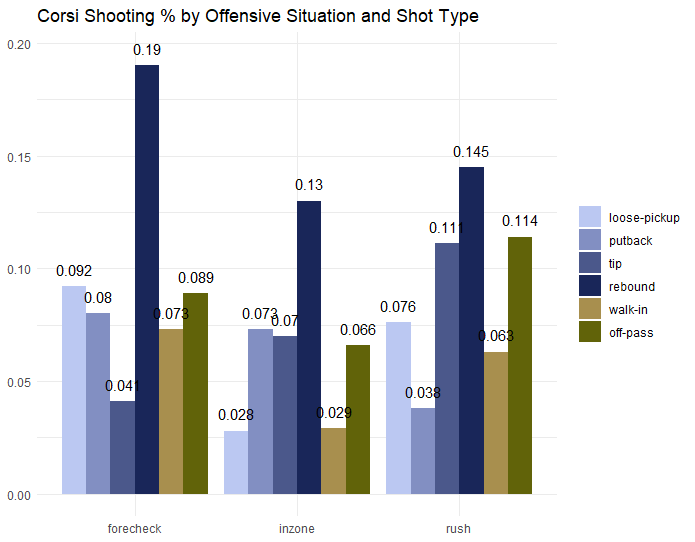
When distilling our measurements all the way down to a single number, we are left with some interesting impressions.
This is perhaps the first point in the analysis where I should mention that we are already somewhat at the mercy of sample size. Only tracking one teams’ games and only mean we only have around 3% of the possible sample size. Removing special teams only further compounds the issue and distilling all the way down to chances another step yet again further. When looking at the cS%, make sure to take a look above at the total corsi for each shot type bin.
Pure rebounds are still quite dangerous. They aren’t very numerous but considering the emphasis placed on them culturally, perhaps there’s merit. If I were to consider putbacks and rebounds as the same sort, as an ethical analyst might, the cS% would be as follows:
Rush — 9.26 cS% (10/108)
Inzone — 10.1 cS% (22/218)
Forecheck — 13 cS% (6/46
The more interesting takeaways, at least from my perspective, would be the disparity between the more controlled types between rush, forecheck and inzone. Off-pass rush chances are among the most dangerous possible to create while also having one of the more robust samples at the same time. These are high quality chances and while it’s easy to surmise that a rush sequence with multiple participants might also suggest a breakaway or something similar, without even better data we won’t really be able to pull this apart much more.
In comparison, walk-in chances are finished significantly less frequently than those with a pass. In many ways these feel like the standard “chance” and perhaps that is indeed corroborated by the similar cS% of off-pass in-zone chances, tips, putbacks and situational loose-puck chances as well.
In-zone tips are the most organized and, seemingly, a much better way of creating in-zone offense than trying to create something through pure passing plays. Whether this would be true of teams other than the Blue Jackets, I can’t necessarily say.
Rush tips are conceptually better though they have a perilously small sample and are hard to conceive of, especially after I leaned on a different definition shorthand that I came by at some point during the year.
During the season, given the differing nature of certain shot-grades by NHL trackers, I decided that the players’ body and stick position should differentiate between a tip and an off-pass chance. Essentially, if the player is facing the net, especially in back-door redirect scenarios, I considered this an off-pass chance. It should be tantamount to a one-timer in function though certainly different in form. If their back is to the net, the shot is considered a tip. Perhaps this change in methodology explains some of the rush-tips when otherwise they’re difficult to imagine.
Incorporating Passing
As we move toward the final step of this quicker version of the analysis, we start getting into some difficult weeds. First, the sample size continues to get smaller. Second, we start fragmenting pre-shot information into separate buckets and, at least to my eyes, start heading toward some partially unanswerable questions.
For example, it’s difficult to ascertain whether the creator of a rebound, as in the shooter of the previous shot, should be credited in any way for creating said rebound. Similarly, does a tip come from a pass? Is a tip even a “shot” or is it an enhancement on a previous shot? Some shots graded as “rebound” shots were indeed gathered and passed. Should these still be considered rebounds with a pass (and a tertiary shooter who created the rebound) or are they better considered off-pass shots? sometimes shots that are passes bounce off defenders and as-such go in the net even though they weren’t every played in that direction.
In each case, you can find evidence of intention in every direction. Players do shoot for rebounds as pseudo-passes, players do shoot for tips as pseudo-passes (especially wide and also tips definitionally cannot come without a second player involved) and players do try to bank pucks off of defenders (or even the goalie a la Marchenko) into the net. Should we consider these as semantically different?
These aren’t questions that are necessary to attempt to answer now but they are fun to think about. If we are to use passing information to help apportion credit to more than a single player answering them becomes more necessary. For now we are simply moving in the direction of understanding offensive situations and the value of passes better. Let us leave this semantic death spiral and begin by defining some new terms.
Given the exercise in front of us is all about creating discrete boundaries where there perhaps shouldn’t be any we must then continue with defining some passing boundaries. Based on the Original Research of the Passing Project by Ryan Stimson, I am afforded some pre-made definitions to examine. Namely, behind the net and “royal road” passes.
You will perhaps notice the dramatically increased sample that Stimson and co were dealing with making it much neater to make more powerful conclusions. In our case, we’ll hope to build and compare.
I will spare you the details of creating the pass-type buckets but safe to say it was relatively easy to determine. The definitions are as follows:
Cross Lane: a pass that crossed the median line. In this case, it must have ended up in the predefined “chance” region but could come from any in-zone location on the ice.
Below Goal: a pass that came from beneath the goal line and into the chance area
Same Side: a pass that did not cross the median nor the goal line
Below + Cross: a pass that crossed both the goal line and the median
Out of Zone: a pass that came from the neutral or defensive zone
No Pass: a shot that did not have a relevant preceding pass either because it was made with no pressure (like an exchange behind the net in a set breakout) or happened an exceedingly long time ago
It is thus important to remember some of the more existential questions from above. For sake of ease of study, only walk-in and off-pass shot types are considered in the following plot. Conceptually, there are loose-pickup situations, rebounds and tips that have players that might be considered as “setup” players but whether or not they should be considered passes is not clear. I will attach plots for those types at the end of the article if you’re interesting in combing through.
One of the other bigger problems of looking into interactions and passing types is multi-dimensionality. This makes talking about or demonstrating the now numerous potential situations very time consuming and therefore difficult to do cleanly. Instead of spending more time talking about how difficult is, I shall instead throw you in the proverbial deep-end.
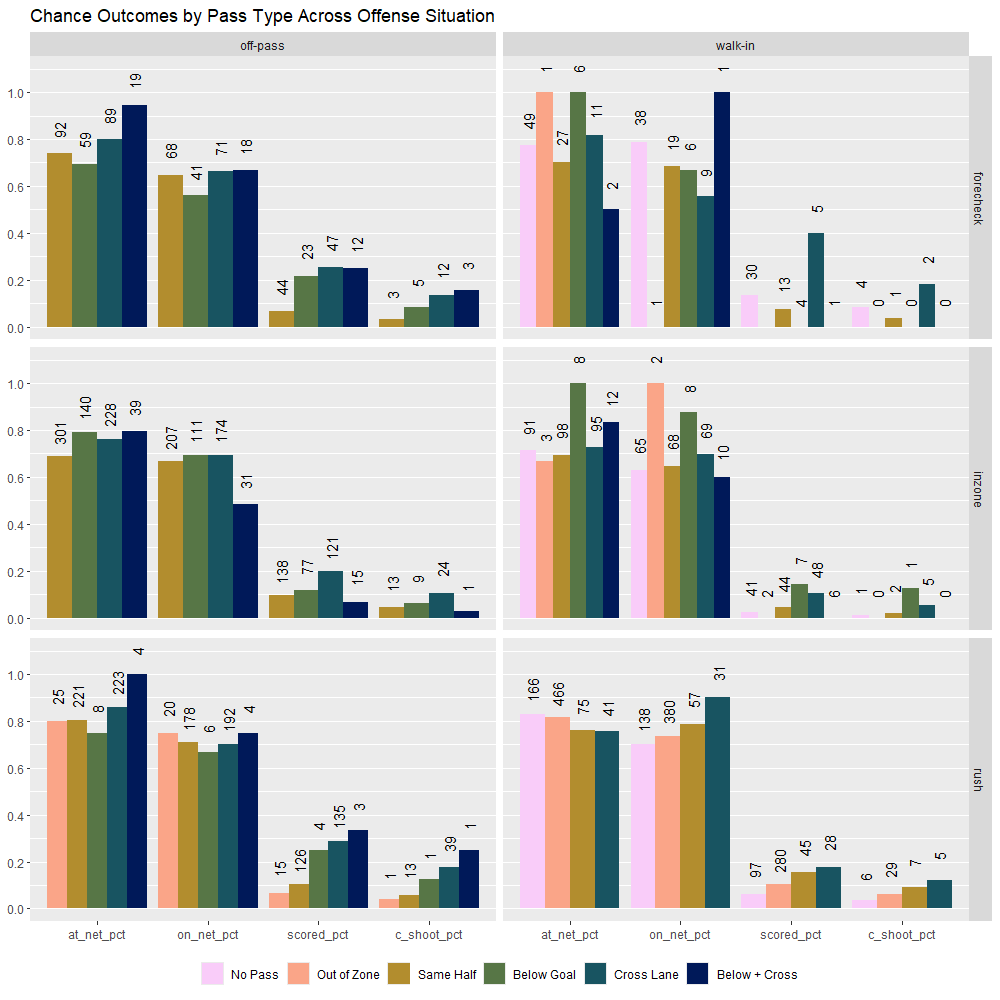
I have attached some number annotations to each bar that are not explained whatsoever and which should be confusing, so allow me to clarify.
The annotation above the leftmost bar groupings numbers (at_net_pct) represent the total Corsi of the situation. Each successive bar group represents the number of “shots” that made it to that eligible group save for the last (c_shoot_pct or cS% which should really be another micro-plot). The numbers above this last group is the total number of goals from each given pass/offense/shot situation.
I’ll demonstrate with a specific group, Below+Cross under the off-pass and rush headings. The number is 4 which means that there were 4 shots (corsi) that were off-pass, rush and below + cross. The bar is at the 1.0 position which means 100% of these shots were at_net. Because there were 4 unblocked shots, the same number exists for the on_net_pct. This bar is just below the 0.8 so we know that, using these numbers, we can presume 75% of these unblocked shots were on-net. Ultimately, 1 shot was scored (33% of 3 on-net shots) which brings us to a rather astounding 25 cS%.
Normally these bars would be annotated with the real numbers of the percentages to make viewing easy but I hope instead that giving easy sample size would help capture everything we could in one image rather than supplying you with more.
General Offensive Situation Observations
By definition, certain offensive situations have certain types of shots available to them. The counts then are pretty critical to our understanding of the differences between types of offense.
I think the presence of threatening pass types, and their increased scoring, does a lot of work to explain why rush and forecheck chances are scored more often than in-zone passes. These are highly dangerous passes but they are also exploiting already destabilized defenses
Forecheck chances are very dangerous and easy to score but evidently more difficult to get on net than their scoriness would imply. Players who can quickly organize or otherwise handle difficult passes to get shots on net are sure to profit.
Extended Carries
Walk-in shots, of course, have many more shots without passes and carries that started outside of the offensive zone. These specific shots have poor finishing rates and non-rush walk-in shots appear to be insignificant from a goals perspective. Extended carries, such that they are, are difficult to score for anyone. Perhaps this is all the information we need that defenses, over time (without puck-carrier changes), trend towards stabilization and goal prevention.
Similarly, the closeness of the most recent pass seems to have a quite large effect for rush chances. No Pass shots were scored poorly, out of zone passes marginally but distinctly better and same-side passes scored even better there still.
That a chance (or any shot) comes from a pass perhaps then carries more information about what has happened to the defense just prior to the shot. If a pass is completed in the defensive or neutral zones, that seems to give the defense less time to stabilize and prevent chances than a longer carry from the same area. Maybe that’s something of a Blue Jackets specific issue as well.
It’s also worth mentioning that we still do not have the fidelity to examine walk-in chances particularly well either. Perhaps these trend toward more perimeter shots and carries that also cross the median are equally dangerous or there are other “shot type” effects like backhand shots or some other confounding effects.
Cross Lane Passing
The data is overwhelming but the quickest takeaways are simply that cross-lane (or cross-slot or royal road) passes still appear to be far more threatening than any other measure we have. Off-pass shots that were preceded by median crossing passes capture an overwhelming plurality of actual goals ( 75 goals from off-pass x cross-lane, 50 from off-pass x everything else, 68 from all types of walk-in goals).
The shooting percentage on cross-lane chances that make it on net is simply ridiculous at 24.27 %. This is slightly more than Stimson’s original research though he does include all shots (80% of which were chances) whereas I am only including shots in the interior.
I don’t really know what to make of this information save that it seems similar. While my “cross lane” passing heuristic would include point-to-point, it seems unlikely that the same is true for Stimson considering 80% of the shots were considered chances. Whether cross-lane passes have increased or decreased in scoring capacity and volume would require data from plenty more teams, anyway.
Closing Thoughts
While there’s plenty better analysis to come, I am quite pleased that this level of distinction at least gives us some rough definitions of the different types of offense. Forecheck and rush offense, obviously, come from more open environments but the most pressing threats from each situation are different.
Rush offense is the most commonly understood and certainly the most voluminous when it comes to direct scoring opportunities. Given the nature of transition offense, and thereby agency over pre-shot movement conditions, a vast majority of these shots come from controlled shot classifications. This is really the only domain in which extended carry opportunities result in goals but it’s still clear that they are far less dangerous than anything that comes from a pass.
In-zone shooting, at least through the lens of direct scoring threat, is comprised quite differently than the more controlled rush offense. While there are perhaps many judgements and improvements to be made should I find ways to include fatigue, multiple-shot sequences or even filtering out shots from slow rush or forechecking situations or faceoffs, I believe the difficulty in scoring these shots helps establish some of the fundamentals of defense. Organized defenses are difficult to score on through every level of outcomes.
What we observe therein is an increased utilization of tipping. While the other situations have volatile outcomes as a result of the small sample size, in-zone tipping appears to be a high quality way to generate dangerous chances. Their approx. 7 cS% compares favorably with other in-zone off-pass metrics save cross-lane passes.
Forecheck offense appears to be a high leverage version of in-zone or cycle offense. While there aren’t very many chances, they offer just about the best access to below-net scoring opportunities. Despite the high capacity to convert shots-on-net into goals, the difficulty of high leverage situations is expressed mostly in that they are difficult to get through to the net. In that way, we can perhaps describe forecheck chances as highly opportunistic.
If you are well versed in statistics, you might notice that I didn’t do particular work on actually ascertaining whether there are interactions between any of the above variables. For now, I think we’re best to avoid anything overly certain and conclusive. I am already skeptical of generalizing this dataset to everything and, furthermore, believe this method of binning and discretization to be barking up the wrong proverbial tree.
One of the bigger goals of this project, and the reason in splitting this down with such granularity, was making an attempt at creating a better “chance” definition for single-game breakdowns. Using xP1 for a single game feels, a bit, like it’s missing the point in describing the quality of an individuals’ performance. Considering none of that data is modified by pre-shot information, incorporating passing “adjustments” might help us move beyond the mere interiority and better weight situational shots. I don’t know that I’m quite there yet but these raw numbers might be enough to create layers for a sort of crude passing adjustment.
The next steps will be to transform this sort of information into more continuous variables that could be incorporated into a sort of expected goals or offensive threat model. Conceptually, these would have something to be with angle change and time to release. In any case, we could at least use a spatial relationship to help create single-number values that could then be modified by pre-shot information. We wouldn’t have to worry about the differences between chances and shots, or even high danger chances and medium-distance chances, because the percentages would be continuous with the leverage.
I think the nature of this fragmentation might also express some of the problems with the volume of data required to draw conclusions about players. If an entire team starts getting sample size numbers in the 50 range, how can we ever create normalized or underlying adjustments for shooting and passing quality for a single player who only ever gets close to 200? I suppose that’s a problem for the other day and one that has been most well tackled up to this point by Micah McCurdy at HockeyViz. Should things go well, perhaps we can create a sort of pass-value-added to an individual before beginning another semantic spiral about how we should appropriately split credit between the shooter and the setup(er).
Until then, enjoy!
Extra Charts
Given that I did not include all other types of chances for brevity, I thought I would simply include them here at the end. I have not quite done the level of data cleaning on these shots, as I’m sure you’ll see. Given that this was a year of exploration, it’s certainly likely that I changed certain tracking philosophies at least part-way. How can there be loose-pickup rush shots from out of the zone? Either a clerical error or perhaps these are indicative of counter-attacks, I am not sure.
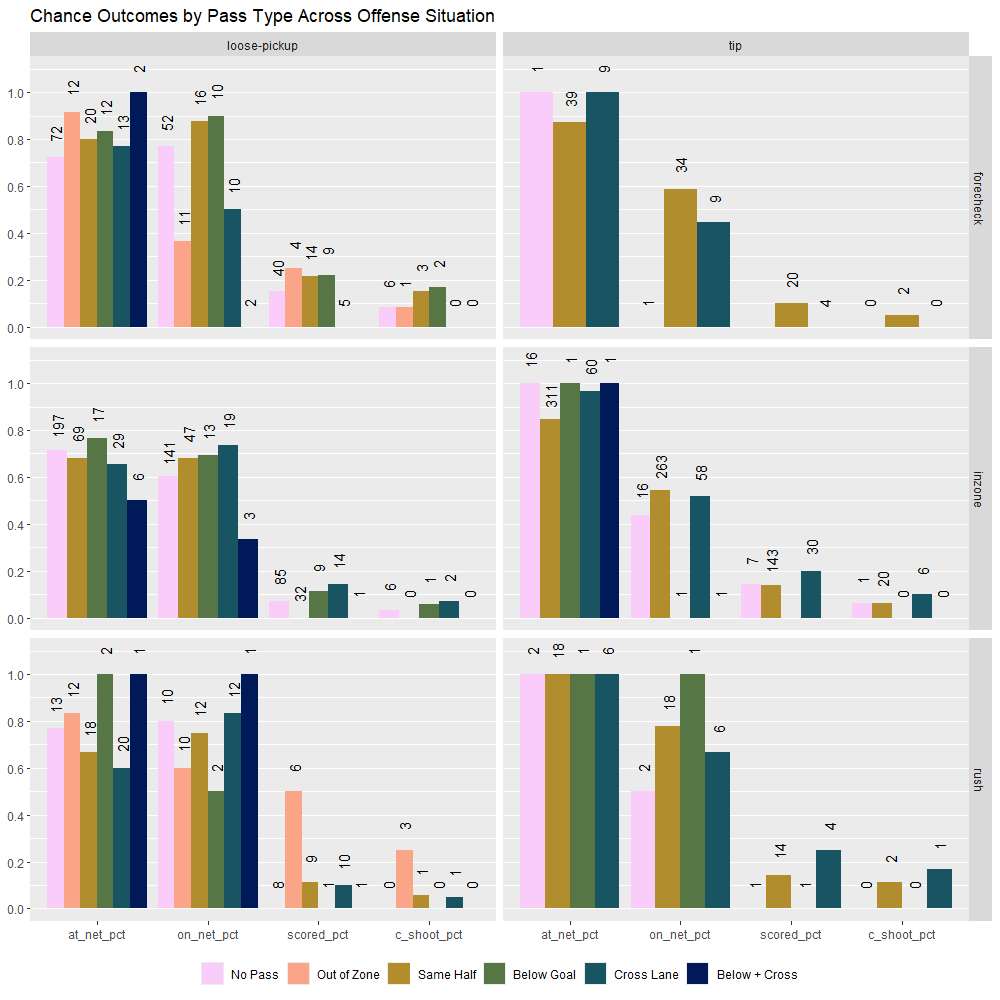
While I expanded the reasonable definitions of a “pass” in some of these “loose-pickup” situations, it’s always possible to simply eliminate them if they prove to be pointless. Here, they can be interpreted as “takeaway or turnover creation” that the shooter benefited from despite that action not being credited otherwise as a pass. In my view, if a player stick checks another player and causes a loose puck and said loose puck is shot into the goal, the stick checker deserves a large amount of credit for creating the offense. If we had developed xThreat models, I think this would already be the case.
I won’t go further but will say that the nature of NHL’s assessment of points, and the assumptions made about what counts, might not actually describe the actions that contribute to scoring and wins. We have more technology now and the fundamental statistics we use to describe the game should perhaps be examined.
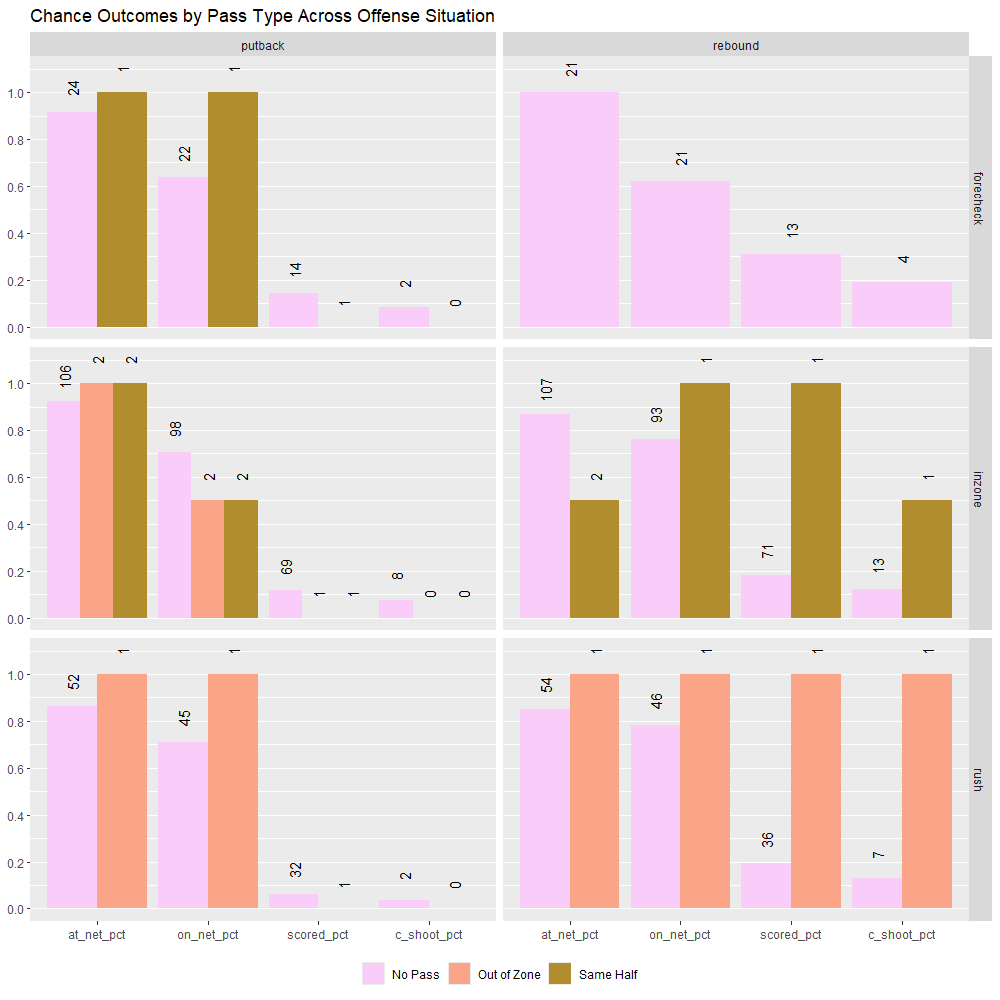
The rebounds, similarly, are quite messy. I assume all out-of-zone data is from clerical errors and would have certainly expected there to be more than 7 passes off of rebounds, though perhaps I already tracked them as off-pass from the “rebound” possession origin (the more specific offense situation tracked column featuring .