
Tracking + Post-Game Chart Improvements
Blocks! New Offense Bins! New Charts!

If you’ve been following me, I assume you’ve seen the post-game charts that I post in various places. I’m trying to figure out a way to post them here without flooding inboxes but haven’t quite wrapped my head around what to do. I’ve been posting the threads primarily on x.com, BlueSky and in the PDOcast Discord. Lately it’s been pretty much just BlueSky and Discord.
In any case, I have used the Olympic break to make some small improvements to the tracking project, most being under-the-hood stuff that makes future improvements easier, and rethink how I’m doing each of the post-game charts. While I have also realized that there are still some structural improvements I need to make, and didn’t quite accomplish the goal of spatial shot maps and/or integrating passing data, I am happy with the new contributions.

The bigger changes include a different way of “binning” offense types to give a quick look into the state of the game from the big picture but mostly including xG values for blocks and eliminating xG against empty nets, which is a necessary improvement I think.
I’ll post every chart here and quick explanations just after them.
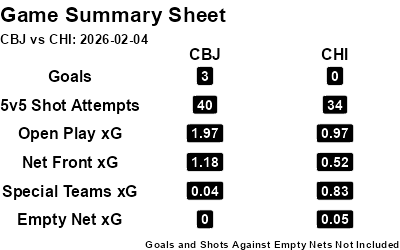
This is the most simple game summary sheet that I can think of. It's essentially just a hardly-colorized table. I would to eventually change the highlighting to make visual takeaways more clear but I think that’s “luxury” and not quite a critical change.
The important things to discuss are the new “types", I’m really running out of terms to describe the distinctions here, of Open Play, Net Front and Special Teams and the omissions that aren’t explicitly clear.
Open Play includes offense from sustained possession or any type of offense that is created from passing or takeaways. This includes “even-strength” situations that I have previously binned as “special teams” or “odd-strength” such as 4v4 and 3v3.
Net Front includes offense from tips, deflections, rebounds and any of the chaotic, pseudo-rebounds from blocked and/or missed shots that come from the “slot” or “homeplate” area. It’s not perfect but I think this general bin reflects one of the “fronts” in the battle between the two teams.
I have wondered if I should create some more avenues of description but decided that overlapping wasn’t worth the cost of extra information. Mike Kelly of Sportlogiq, or whatever it is now, likes to talk about “turnover” offense and I certainly considered that but don’t have an adequate definition of “turnover”. Time after change of possession? It’s certainly something that’s important to understand but I’d have to track it specifically, in terms of looking for “phase changes” of a defense created by said turnover, so that I make sure I’m not introducing the randomness.
Special Teams is now all versions of powerplay and shorthanded. It seems like an appropriate bin. I have considered including “number of powerplays” or something to that effect, which would be a helpful shorthand for one of the other “fronts”. On one hand, drawing penalties is nearly guaranteed to create “chances”. On the other hand, evaluating performance within those chances is also important. For now, I’m sticking with the single dimension of total chance danger to capture both.
Empty Net xG is the most important aspect by way of omission. This does not include shots against an empty net because of their chance danger distortion properties. This has implications for the Goals metric there as well. These are only goals scored against goaltenders and not empty-net. I assume I’ll get into trouble with easy misunderstandings there but is what it is.
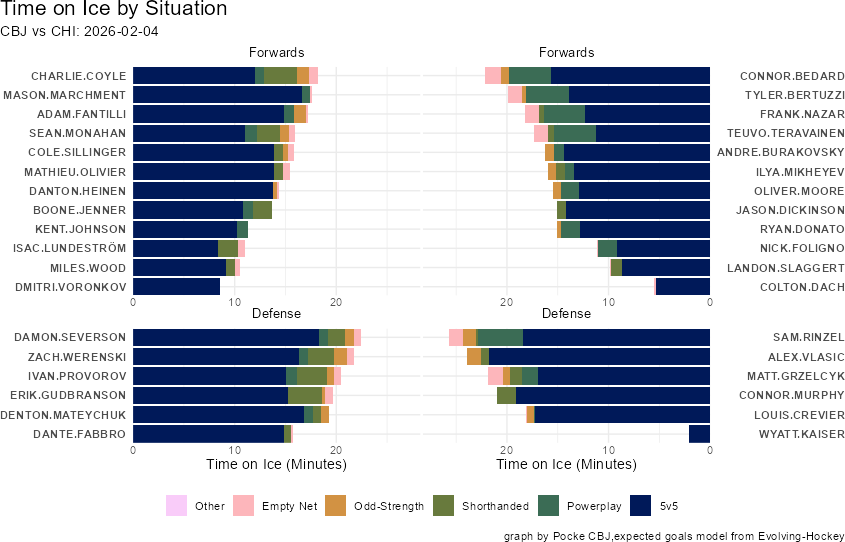
No changes to the TOI chart.
The first changes to the overall data can be observed here. No longer is the grey “Block” legend a wasted placeholder.
Blocks are now assigned an xG value, I suppose I should explain that methodology. It’s rather rudimentary. I am “binning” all shots, and their passes, with rough location bins as part of my manual tracking. This is intended to be information used to determine pass-danger but has the side effect of also tracking block location with more fidelity than is possible from NHL PxP information.
I have taken all shots (non-blocked attempts), separated them by bins and shot type within those bins (off-pass, walk-in, tip, rebound etc) and taken the average xG value of matching bin-shot-type that we’ve observed this season. This includes CBJ shots and Opposition shots at the same time. Perhaps I am introducing some error but bins looked relatively even from a symmetry perspective, and the average xG values logically consistent, so it feels like a good starting spot.
Better work would probably include a more naive xG model, rather than one that includes information like “time since last event” but that’s a conversation for another day when I am diving into the passing work.
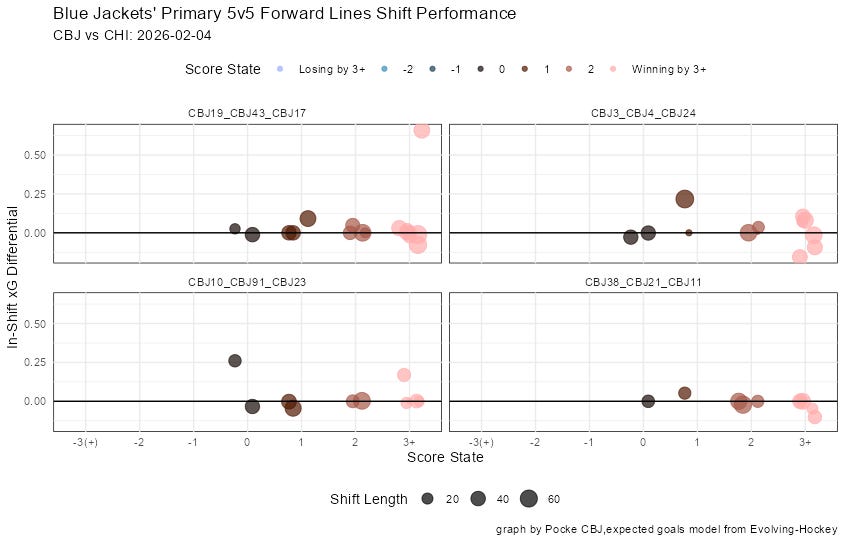
No change to prominent forward line shifts. It’s still a bit messy, especially under the hood, but that won’t change until I get some time to dig into it.
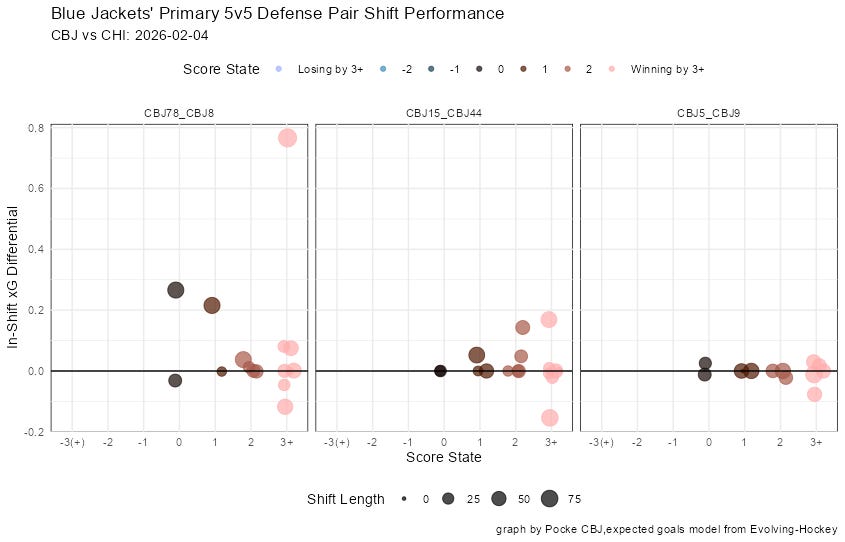
I have also done the simple work of doing the same for defense pairs.
Keep our fingers crossed that there are no 11-7 games because that will be really annoying with my very rudimentary NHL PxP processing and desire to neatly visualize this sort of information.
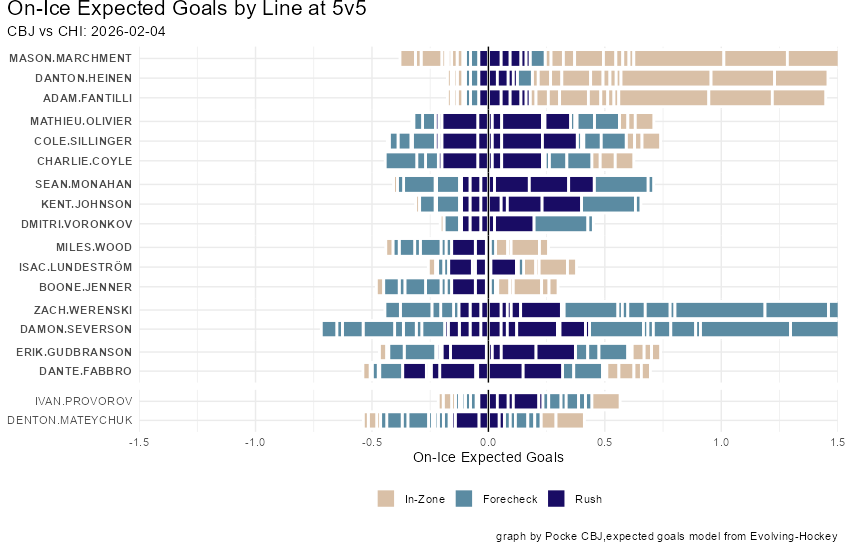
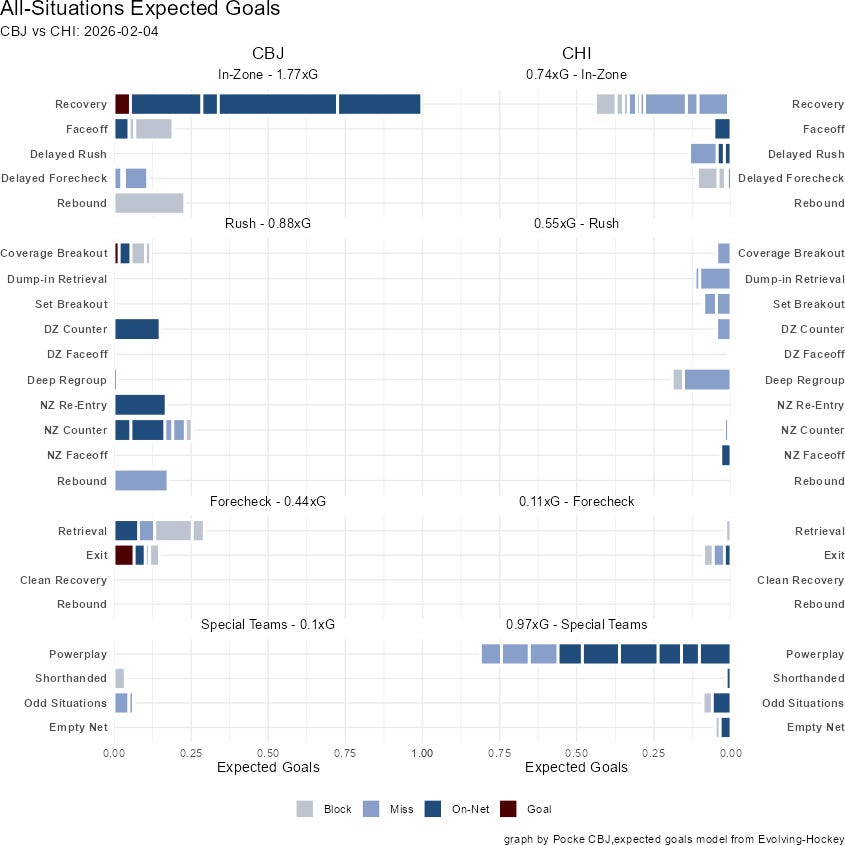
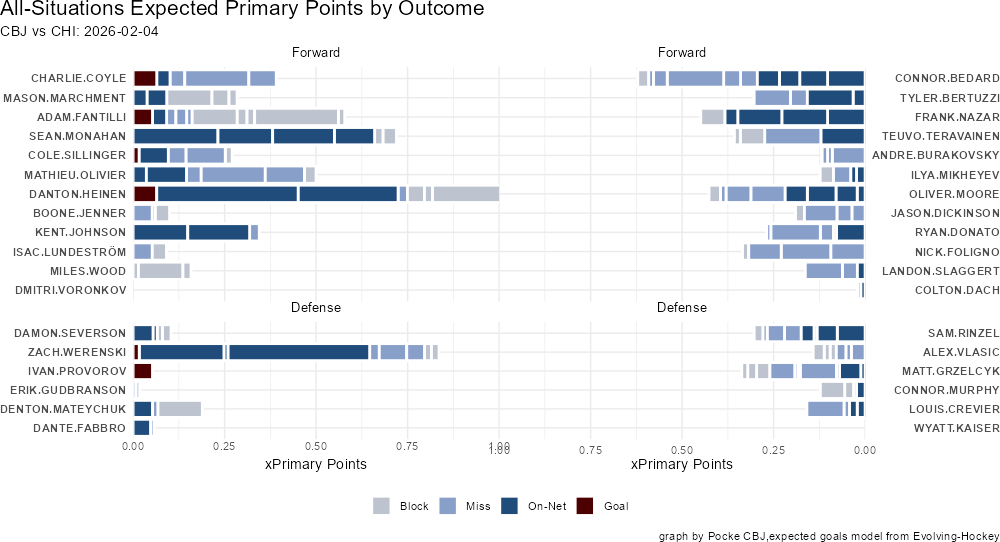
No changes to On-Ice xG by situation plot except that blocks are now included and have xG values. Perhaps this means we need to think of the chances differently, perhaps they should be changed anyway via incorporating blocks, but I’ve made another chart to help.
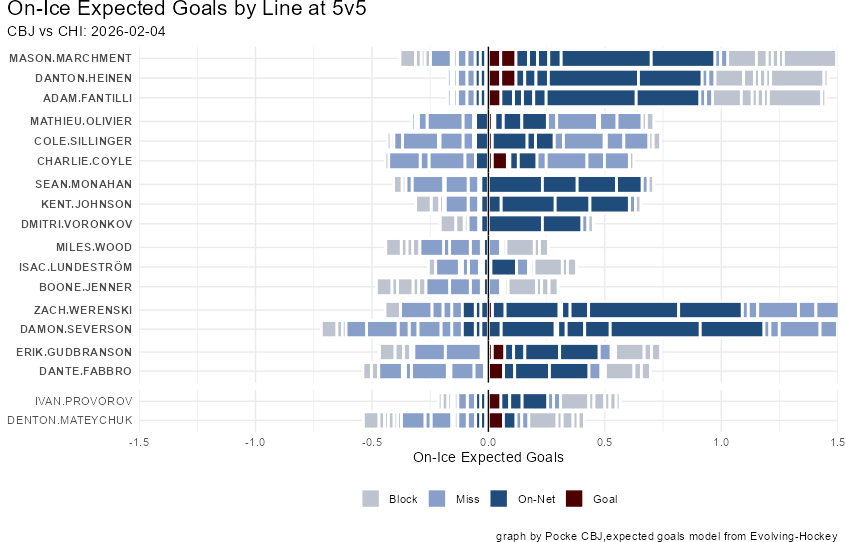
We’ll have On-Ice xG by outcome! If a defense pair, or forward group, blocks a ton of shots we’ll have a good idea just how much they saved their team. Potentially neat information but also certainly useful in determining how many actual goals a player was on the ice for at 5v5.
This is a fun one because it illustrates just how poor Chicago was at creating meaningful offense with the added layer of how they couldn’t get it on net even when they did.
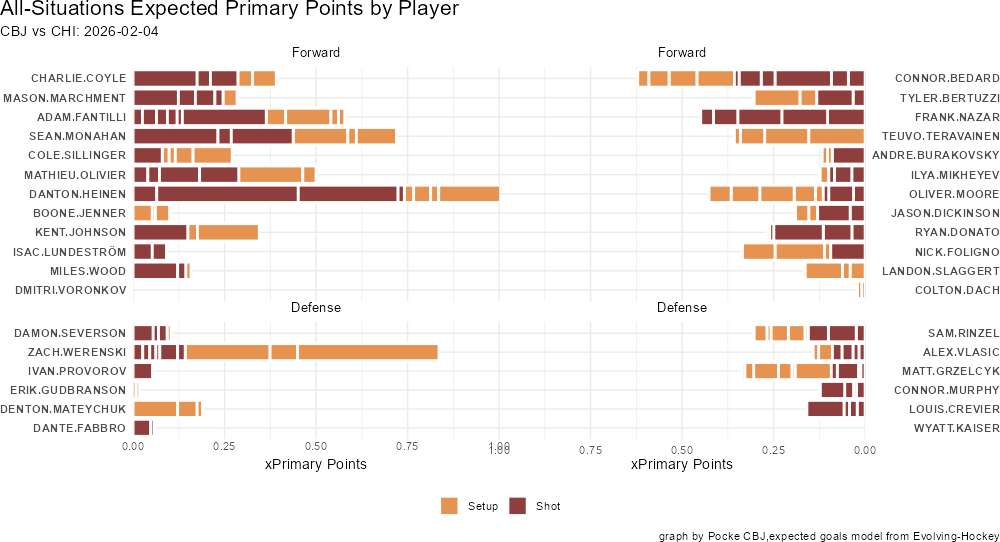
As we turn to player contributions, we’ll see the most “zoomed out” look hasn’t really changed.
Individual player data now includes blocked contributions as well. Before, Adam Fantilli looked like he did nothing. Now, it looks like he had a great game but struggled to get shots/passes on net. Unlucky? Poorly played? Maybe we’ll find out.
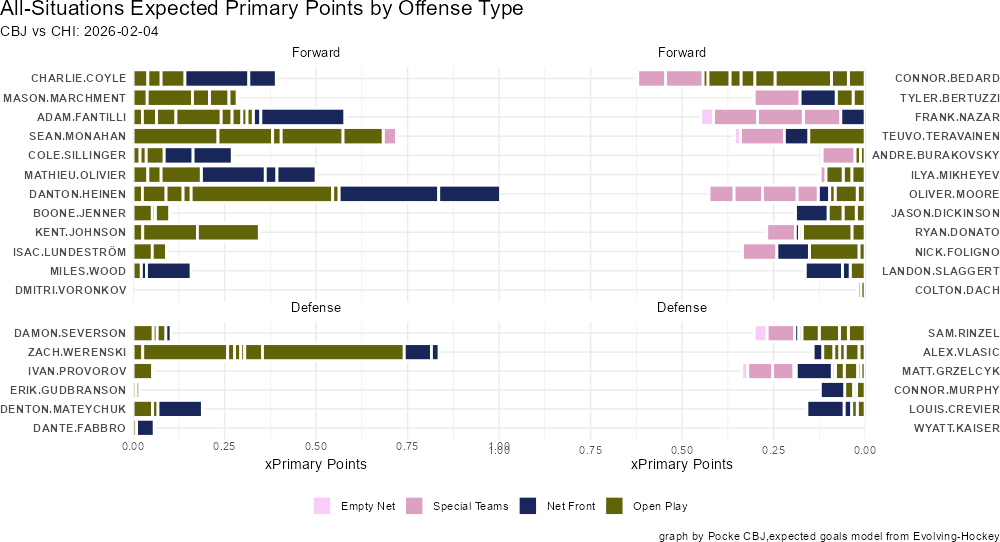
The most changed “All-Situations” graph was done to help conform with the game summary sheet. I struggled how to display this one, primarily because I have moved away from the carefully designed SciCo color palettes but I wanted to keep the bins consistent with colors from charts elsewhere.
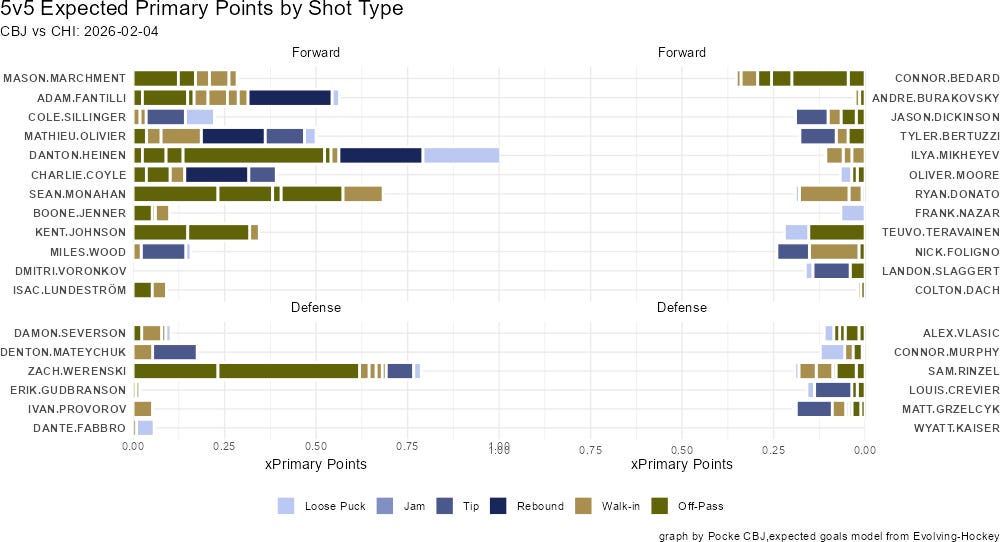
It is down at 5v5 where I have decided to resume the standard “shot type” bins. I hope the color similarity with Open-Play and Net-Front makes sense. If not, I’ll have to retool the color scheme above.
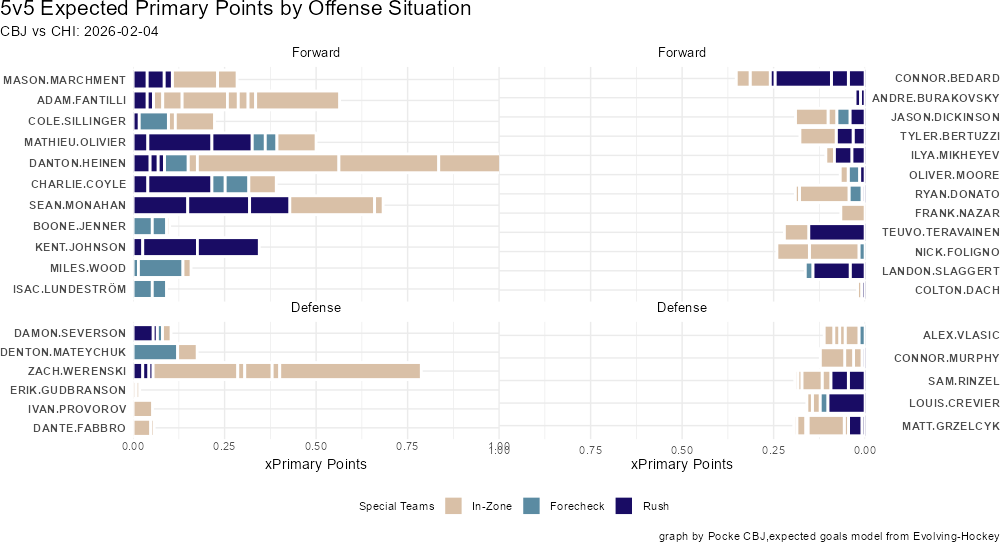
Furthermore I think the “offense situation” is better suited at 5v5. Powerplay contributions relative to all situations makes sense but I think how I did it above is more useful.
Wrap Up
These are likely the final changes to the tracking and charting for this season. There are plenty of aesthetic changes that I could certainly make to improve the charts, as well as perhaps more but I don’t expect there will be time to make them in the condensed back half of the season.
I have a tremendous list of ideas to build more interesting representations of the data, and an ever-expanding list of research questions that are likely impossible with given data and my current skillset, but I suppose that’s what the summer is for.
Welcome back. ;)
I'd recommend using more contrasting colours for the TOI chart. These not too old eyes o' mine had some trouble distinguishing between PP and SH.
I'm happy to see you're planning to give some additional serious thought to passing. It's probably the singular most glaring fault of the simplest xG models.
Good show with Filipovic, by the way.