
Tracking + Game Visualization Explainer
A full explainer for the metrics, visualizations and some minor philosophizing and future gazing for the project

Tracking Project Definitions
Shots
At first blush a “shot” is easy to understand. We all know what a shot looks like and the idea of it is quite simple. In trying to create a rigorous definition of a shot, I tend to get a bit existential.
For the purposes of all of this data and the tracking project Shots will be what are commonly referred to as Shot Attempts or Corsi. Any “Attempt” or “Specified Action” that puts a puck towards the net with at least some degree of intention.
I will not be counting obvious unintended deflections from passes or dumped pucks on net from over the blue line.
In one of the preliminary research papers Ryan Stimson and Micah Blake McCurdy offered an argument that Shots were more clear than Shot Attempts and should therefore be used over including attempts. I don’t explicitly agree but I’m moving this definition to align with how AllThreeZones and other outlets are using Shots and Shot Assists. More on it later.
Shot Assists
Shot Assists are, therefore, a continuation of the previous definition of Shots.
The pass that lead directly to the shot (attempt).
There’s more philosophizing that could happen here and I don’t have a completely rigorous definition. There are some soft lines about whether or not a pass lead directly to the shot but for the most part “lead to the shot” is already a more rigorous definition than what is applied to assists in the official scorekeeping.
Miss vs On Net vs Goal
These three options represent all of the available outcome possibilities in my tracked data. You might notice that I’m missing a common event called blocked shots.
In my tracking data miss= blocked shots + missed shots. For a couple of reasons, I think it’s quite difficult to determine whether a shot was missed, blocked or even saved but wasn’t on net. For that reason, I have bundled them all together.
I’m certainly leaving some information on the table by doing so but it’s easy enough for me to rationalize them as both part of the same sort of thing. If a shot missed the net it was influenced, at least enough, by the defense. A stick deflection near the net, near the point of release vs a complete body block hardly makes a difference.
If we had even better data, such as pressure and/or goalie screen information, perhaps there’s a better story to tell by distinguishing the events. For now, I’m keeping it streamlined for the sake of time.
Tips And Why They Are Different
In including tips as a different bin of shot, I am committing somewhat of a data representation sin. The rest of the shots are purely location based whereas this bin is really more of a shot type judgement.
Tips is also, perhaps, a bit of a misnomer. This is a bin for all sorts of jams, wraparounds, tips, pokes and putbacks near the net. I am assigning them a different classification because I believe they don’t fall under the same umbrella as “shots”.
For the most part, the distinction is primarily vibes based but also I hope to utilize their “separateness” as a means to test the hypothesis or to test the vibes.
These events typically make up an overwhelming majority of the extremely high xG shots recorded and as such I believe merit deeper study and further understanding. The overwhelming volume of shot data feeding xG models should mean that these are still valid percentages but something feels off about stuffs with little intention being regarded as among the most dangerous shots in the sport.
My hunch is that there’s “higher hanging fruit” to be found in properly picking apart the data but I’d also very much welcome demonstrating to my gut that it’s definitely and explicitly wrong.
To better clear up any potential confusion, I’ll probably try to come up with a better name for this catch-all bin of net front chaos shot types.
Ice Geography
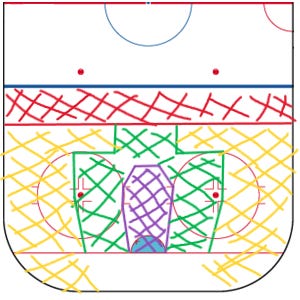
Apologies for the crude drawing but I had to leave space for some more advanced graphs. For the most part, these are the locations on the ice that I will be using to delineate shot location.
Red = Point, Yellow = Exterior, Green = Home Plate, Purple = Inner Slot
When I started the project, I sought out to use familiar verbiage. There were shots, scoring chances and high danger chances. As I got more into the weeds, I felt that labeling the shots with “judgements” had potential to bias our understanding of what the shots were. I read perhaps too much about the “Big Chance effect” and how it was post-shot information to have perhaps too much sway on expected goal models.
That’s a bit deep, perhaps, for the time being. Just know that for now I’m going with a more raw ice geography nomenclature until I can settle on better definitions of pass, shot type and other information contribute to whether something should be recorded as a “chance”.
Exterior vs Home Plate vs Inner Slot
I think the most important information and deliniations will come from shots within the homeplate area. While I don’t want to tread into subjective ground too much yet, I don’t want to be agnostic to the point of stupid either. A backhand from the faceoff circle should quite clearly not be regarded the same as a one-timer from the same area.

I will be inputting a “soft adjustment” based on Hockeyviz’s heatmaps based on his “observations” based on 5v5 shot types. The most critical row is the bottom one for these purposes.
Wrist/Snap will have a fairly standard attribution of the HomePlate and Inner Slot areas whereas “slapshots” or “onetimers” will be expanded. Tips/Deflections are being accounted for differently, as I have strong concerns about the data validation from tracking, and backhand will have a quite tight window.
Perhaps accounting for these differently, akin to Natural Stat Trick’s point based system for determining Scoring Chances vs High Danger Chances but that’s a deeper project for another day.
Shot Contributions
Any time you see the word “Contribution” know that you are getting the combination of shots and shot assists of the given metric. In all cases, I suppose only relating to assists, is that this metric is all primary contributions. There are no events being tracked outside of the shot and the pass leading to the shot.
Offense Type Definitions
For many of the game state definitions the only shots being tracked are the first shot of a given sequence. I have added rebounds into the data as they were heavily biasing the shot count toward “In Zone Recoveries” given I didn’t have another way of displaying the information.
For now, rebounds will be counted as coming from the given game state as the shot that created them and displayed accordingly.
(of note, Rebounds and Deep Regroups were not yet tracked types but will be added going forward)
In-Zone
Recoveries
A recovery is any time the attacking team establishes possession of the puck after a shot, block, turnover or otherwise loose puck. Rims and indirect passes don’t count as recoveries unless there was ambiguous possession for a long period of time.
In-zone recoveries represent the only “unlimited” possibility. All other metrics are limited to a single shot which establishes the origin and, going forward, the subsequent rebounds.
Faceoffs
Faceoffs are perhaps the only true origin of in-zone shots. Up to this point, there hasn’t been a significant number in either way but the information contained within could serve as a useful signpost for understanding the strengths/weaknesses of a certain team.
The shot does not have to come as an immediate result of the faceoff, as in no time based restrictions, but it must be sustained possession and play such that it wouldn’t be regarded as a “recovery”.
Delayed
Each of these, both rush and forecheck, come from sequences where the defense had time to set and stall the immediate threat before a shot attempt. We still get an idea of how the other team got into the zone but can also understand that it wasn’t likely the premium danger that come from forced breakdowns (or was and was the result of excellent in-zone play).
Rush
Rush play, distinguished from in zone play, has long been considered one of the most dangerous forms of offense. It is so dangerous, for the most part, because they aren’t too many defenders interfering with the play and pushing players to the outside.
Corey Sznajder has been pioneering tracking the origin of such rush attempts and his work on the subject is a great read. For the most part, teams in the NHL aren’t creating significant rush danger without counterattacking. We’ll have the data to track where the Blue Jackets’ specific danger comes from but this data is at least quite helpful in telling the story of games.
Throughout the history of stat tracking and analytics, rush offense has typically defined as all shots occuring 4 seconds or less than crossing the blue line. As a response to the league collapsing and defending the rush better, I’m extending that timeline a bit.
Certain teams, like the Minnesota Wild, attack defenses systematically but aren’t as focus on getting a shot within a specific timeframe. For that reason, there won’t be a hard 4 second deadline. Rush delays, etc, will be included in Rush Shots.
It will still be important to understand the relative danger and location of such shots so it’s entirely possible that we’ll still have a good idea of whether or not such delayed rushes did indeed result in dangerous attempts.
Defensive Zone Breakout
Defensive Zone Breakouts will comprise the majority of rush offense. They are any type of transition started in the defensive zone that don’t fall under the umbrella of counterattacks. This could be set breakouts, recovered pucks along the back wall or even exits post-retrieval.
In some cases, the line between a recovered blocked shot resulting in a breakout vs counterattack is simply how many players and at what speed they exit the zone. If the puck goes backward or behind the net, it’s probably a breakout. If the defending team can get back into a reasonable formation, it’s probably a breakout.
Defensive Zone Counter
Counterattacks come from turnovers, blocked shots, etc that lead to immediate possession and transition offense. This isn’t slow and is a common method of creation for specific types of teams. It will often result in odd-man advantages as a result of the opposition being unprepared for change of possession.
These types of chances will likely be proxies for advantageous rushes.
Neutral Zone Counter
The neutral zone companion of counterattacks with a similar criteria to the defensive zone counterattack. This type of offense is generated after turnovers, strips, blocked passes or otherwise in the neutral zone and during transition.
There is a bit of grey area on either side of the blue lines. If the puck has just crossed the attacking blue line and is turned over, it will be counted as a neutral zone counter. The rush is still happening and I don’t want to be too rigid about zones. The spirit of transition turnovers and counterattacking is more important.
Still, shots and pucks below the dots will always be considered defensive zone counters.
If the puck is still in the defending zone and is turned over, it will be graded as a forechecking exit turnover.
Neutral Zone Re-entry/Reload
Neutral Zone regroups and reloads can be somewhat different forms of offense. Re-entry offense is commonly a result of a forced zone clear that leaves the zone but doesn’t cross the red-line. Teams will usually attack quickly to re-enter the zone though teams differ greatly in their approach to creating offense from this position (the Blue Jackets are opportunistic but other teams like Nashville or Florida appear more structured).
Reloads can be from stopped entries or players who decide not to attempt to enter the zone and otherwise retreat before attacking again. These are important to distinguish from Deep Regroups but close enough to Re-entry to be a similar category.
Shorthand is short-field neutral zone transition.
Deep Regroup
Deep regroups are the offense made from re-entry or reload situations but where the defense is forced to retreat deeper into their own zone. Oftentimes this comes from good post-turnover defense but also from line-changes and times where a team wants to set up a set-breakout play but aren’t otherwise contested in exiting their zone.
I could probably bundle this with defensive zone breakouts but I think it could yield interesting data.
Forecheck Turnover
Tracking forechecking turnovers separately from other kinds of offense is, at least I hope, intended to serve the purpose that it is a valid method of opening the slot for extremely high danger chances.
For the purpose of this project, forechecking turnovers are considered primarily offensive zone turnovers. It would be fair to conclude that neutral zone counters and neutral zone regroups are types of offense that derive from good offensive and neutral zone forechecking but they also require downhill possession plays.
Retrievals
If rush offense was a common method of cashing in on defensive breakdowns and is now being foiled by commited structure, disrupting puck retrievals on the back wall and immediately hitting the slot should be considered equally dangerous.
Defensemen have their back turned and are sealed against the wall, great forecheckers disrupt this and even better forecheckers turn it into offense.
The turnover is classified in appropriate time to when the loose puck or turnover was created. If the possession goes into ambiguous possesion for an extended period of time it will likely be classified as expired forecheck. This is an ambiguous distinction and one with plenty of room for subjective interpretation. I’ll do my best to keep it consistent.
If the puck goes above the faceoff dots toward the blue line, it will not be classified as part of the retrieval.
Exits
As we’ve also seen in the run up to this point of the season, turnovers when exiting the zone should also serve as a proxy. This can be a highly vulnerable time especially as transition units seek to stretch the zone and move together.
These turnovers are the result of an explicit pass or carry attempt . They are not always above the dots especially when a defenseman has established possession and is trying to make a play to the middle of the ice for an exit.
Hopefully, distinguishing between these two types will tell us something about the stylistic tendencies of the forechecking units: those that contest loose pucks on the back wall and those that bait turnovers in the higher ice with structure.
Clean Recoveries
Clean recoveries mark something of a difference between the previous two. From a high level point of view, perhaps they could be considered indirect passes off the rush. In any case, a dumped puck into the zone must be recovered and a play must be made quickly for a shot to count as having come from a clean recovery. Up to this point, this has been a rare event.
DataWrapper Interactive Explainer
I am using DataWrapper as a host for all of these charts because I really enjoy the simple beauty of their graphic design and the interactivity of their displays. If you click on any of the above graphs, you can usually highlight data of similar types based on the key or a simple hover of the specific measure.
This will mater more later as I get into scatterplots sorted by position or other more complex visualizations.
If you are on mobile, you are likely not getting the premiere experience within the Substack App or Email. I do not have a great way of solving this issue but clicking or tapping through to the full DataWrapper visualization should give you the best experience possible.
For now, my intention will be to post these graphs within the hour after each game that I am live tracking. Most likely these will all be primarily on BlueSky where you can find me at pockecbj.bsky.social.
Otherwise, I will continue to weave them into the constellation of excellent visualizations from HockeyViz.com and dive into the tape to tell the stories in my next day game breakdowns here on Substack.
What This Data Does
Telling the Story of the Game
This data, whether based on primarily player contributions on differences between teams on a game level, is primarily tracked to serve the purpose of telling the story of the game in question.
It does tell us more or less who performed well with a little more detail than simply CF% or Shots on Goal. It also tells us a bit of the stylistic differences between teams or at least in their performances on a given day.
Help Us Predict Future Production
This right here is the primary reason for tracking shots and shot assists. According to Ryan Stimson, including information about who is passing to the people who are shooting dramatically improves our capacity to predict how many points a player will end the season with. It does so earlier than any other metric.
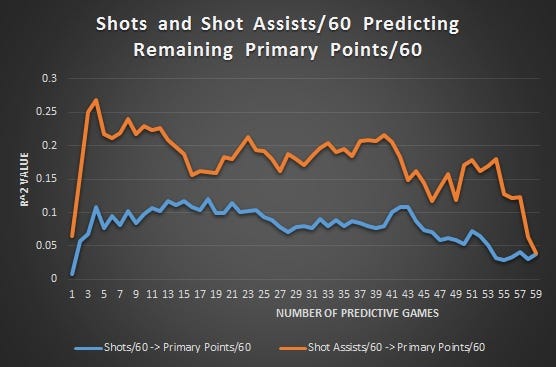
Passing data is critical to understanding a player’s contributions on the ice and one that is unfortunately woefully underrepresented in the NHL’s PxP data. Shot Assists predict all Primary Points (Goals and Primary Assists) better than Shots and remain that way for a long time.
Over time, utilizing shot assist data should help us understand who is likely to continue producing because of their intentional contribution to offense.
Create Signposts for Further Investigation
This is my primary intention behind creating some of the more stylistic team vs team breakdowns. I’d like to have this data, which helps root analysis in reality, and then go to the tape to find out “why”.
Why did the Minnesota Wild have a bunch of counterattack chances? Why did the Toronto Maple Leafs have a bunch of shots from offensive zone faceoffs? Why do 90% of the Blue Jackets rush chances come from Defensive Zone Breakouts (I made this up)?
Above all, it should help guide our observational analysis and inform our capacity to understand the game.
What This Data Doesn’t
Because there are limitations to the data I am not capturing the full picture of everything involved. This is, by no means, a complete picture.
The Moments Between
A great tracking project would include the time and location of all puck touches as well as the players involved and all of the moments between. Initially, I intended to do something like this and especially in tracking transitioning the puck, acquiring the puck on retrievals and defending all isntances. It took too much time and I got bogged down into the weeds as to what actually mattered on the game level.
Where I landed, partially as a compromise to my own sanity, was in tracking the context of all generated shots. If a player entered the zone 10 times with control, who cares? If it didn’t result in at least a shot attempt who is to say it was fundamentally different from a possession that stalled out in the neutral zone and resulted in a puck battle.
There were simply too many edge cases and hockey is too chaotic to get bogged down in trying to track all of the play between these possession defining events. Because I am tracking the origin, I think I’m getting a significant enough picture.
Still, with better data and/or player and puck tracking (and really sophisticated possession value models that find a way to equally value contributions in the defensive end) there’s a lot to learn about relative efficiency of certain events.
It’s entirely possible that a player contributes heavily to the offensive success of their team without making the final pass or shot that lands on the net.
Defensemen
This is, fundamentally, not a good way to evaluate a defenseman’s performance. Some will certainly stand out *cough* Zach Werenski, but mostly we have no information about the defensive aptitudes at play. With some improvements to the overall data we could move signficantly closer to getting a good evaluation. On-ice passing metrics, or metrics that suggest a player is preventing passing, could perhaps form a valuable component in determining quality of play relative to the other team.
You’ll also probably notice Zach Werenski at the top of plenty of lists. He is having an absolutely monstrous season from a volume perspective ranking second in iCF in the league behind only Quinn Hughes. He’s good. He also plays substantially more minutes than anyone else and that’s going to distort the reality a bit.
Adjust for Score Effects, Quality of Competition, Quality of Teammates or Tracker Bias
This data has no context. It doesn’t necessarily tell you why and it doesn’t include most of the modern adjustments and innovations and that make metrics better suited to overall analysis.
Most teams shoot more when they are losing. Most players shoot and pass more when they have better teammates. Same for worse opponents. Most of all, most arenas have biased trackers that weight different events differently (Venue Adjustment). All of this data is tracked by hand by me and as such will be biased through my point of view.
Make Definitive Conclusions
Under no circumstances would I recommend making definitive conclusions based on any of this data. Just because a player has more Shot Contributions doesn’t mean they are inherently better. All analytics and data should be used to paint a mosaic of a player or teams performance. Your opinion and your eye test matter, never believe anything blindly.
Above all, stay curious and have fun.
Why 5v5 Only
For the most part, I am sticking to only tracking 5v5 data because that’s where most of the game is played and because without improvements to the graphs it will be difficult to understand their conclusions on the whole while adding more information.
I’d love to track 3v3, 4v4, Special Teams and Empty Net Scenarios but I don’t have a good way to properly weight their overall influence on games and I don’t want to risk combining a 3v3 high danger pass with a 5v5 high danger pass and pretending like they mean the same thing.
For the sake of clarity and time, I’ll be saving my own sanity and sticking to 5v5.
This does not mean that it’s the only part of the game worth analyzing but binning shots by danger and type doesn’t feel like the best way to represent other game states. With more passing data, shot type, defensive pressure and goalie screen information we could perhaps create an acceptable Special Teams evaluation model.
Data Validation
So the big question here is should you trust this data? Yes and no. For now, I’m just one guy trying to track all of these games and its my first time doing it for an extended period of time. I am not established and not particularly experienced.
I am very much paying attention and doing my best but I am infallible. As a sort of validity test, I compared my hand tracked results with those published on Natural Stat Trick as a proxy for the NHL PxP official broadcast data.
For the most part, they data are quite similar. Overall, it appears NaturalStatTrick counts more overall shot attempts than me but they are indeed in the same ballpark.
When it comes to scoring chances vs interior shots (a combination that utilizes the same home plate + geography) the data gets a little wonkier. For the most part, it looks like Natural Stat Trick assigns plenty more scoring chances to defensemen which is primarily a product of their including some passing weighting and mine being exclusively tied to ice geography.
Later in the season, I will be able to evaluate my tracked data relative to Corey Sznajder’s which will be the bigger validity test from a chance/chance assist perspective.
Until then, I will continue trying to improve my methodology though I will save major changes until I have time or reason to implement all of them. I am somewhat satisfied with the state of the “quality” data but the more important and valid data will remain the bigger picture volume metrics.
Future Improvements
Rigid Geography and Binning
I’m losing a lot of information by not including a continuous spectrum of on-ice geography. I’m making up for that fact, at least as much as I can, by mentally adjusting based on shot type. This does also introduce some subjective error.
The game of inches and feet will rear its ugly head in this area specifically. For that reason, I would only try to utilize this data for its higher level judgements of quality.
No Shot Types
Shot types are, obviously, very important information as it comes to determining whether or not it the shot constitutes quality offense. A backhand from the point and a slapshot should be understood differently.
Linking with PxP and xG Models
If I can find a way to link my passing or assisting data with the NHL PxP I can incorporate a whole suite of information that can help me build better metrics. For one, you won’t have to worry about my personal bias as it will be the data of the same standard as everyone else.
Unfortunately, this would also mean surrendering to the NHL trackers and losing fidelity of tips/rebounds/putback type data.
After getting to this point in the tracking, learning how to utilize this API, associate the tracked data with NHL PxP is becoming somewhat of a priority. I don’t think it’s possible for me to do this all in-season so it might be a significant project for the 2025 offseason.
Better Graphs with Python
I am now frustrated with the limitations of DataWrapper though I also absolutely adore their built in graphic design and interactivity otherwise. Still, they are enforcing limitations that I feel constrict my capacity to make the best storytelling visualizations possible.
For the most part, you should avoid making overly complex visualizations and their restrictions are good ones. In my use case, and especially in comparing one team to another, I think I could add complexity and nuance without destroying readability.
Making bar graphs both stacked and split and utilizing colors and patterns to delineate Danger, Outcome and Type could help me represent the different shot charts all in the same graph. This will be a goal of mine moving forward but it, along with the linking of PxP and xG models, will likely be an offseason project.
I don’t need to go into the details but including TOI information, adding on-ice metrics and creating xA1 and xP1 models would result in some really fun and fantastic conclusions.
Furthermore, with easier access to different game states (4v4, Special Teams, Empty Nets) perhaps it would be easier to expand the graphs to the visualizations without breaking the flow of interpretation and understanding.
Adding More Metrics
For a brief period, I was taking Shot “Attempts” literally and including shots that didn’t quite get off the stick, especially those that were fanned on or were interrupted mid shooting motion by a stick. I still believe that these are worthy of counting as “Corsi” because I think they fulfill the purpose of an expansive possession tracking event. They aren’t necessarily quality shots but they do still suggest potential. Hockey is a game of inches, often, so I don’t see why we should draw the line so distinctly.
The better way to track these “possession style events” would be to track more types of data. I’m very interested in this approach but it gets much more complicated when you try to add any single type of event. If I’m to move forward there, I think I would try to add “Slot Plays” and “Off Wall Plays” whether they are handles or passes.
Also, I am only tracking whether a shot was preceded with a pass and not what type of pass and where it came from. I won’t go into too much detail but adding a couple more metrics, or even adding shot/pass locations with a tracking tool could yield very interesting data.
Right now, the spreadsheet tracking is deviously simple and easy to pull the required metrics. With an expanded skillset, and more time getting dialed in to tracking, perhaps adding more information wouldn’t be too much of an ask.
Still, in moving a different direction from the mainstream or previously analyzed consensus you run the risk of portraying something as “different” or “noteworthy” without the analysis to justify the difference. I suppose that’s an issue to tackle next year after I have a full year of tracked games to test claims.