


Creating a Cohort of Comparables for Kent Johnson's Development
Surveying the recent landscape for forwards in the mold of Kent Johnson and looking for development metrics to predict his next contract

In the salary cap world, few general managers have created as significant an advantage for their team as those who lock up superstars before their breakout. By now, you probably know all of these names. Leon Draisaitl, Jack Hughes and Tim Stützle are the most recent pre-eminent examples of these kinds of players.
These players signed big value contracts immediately after (or extensions during) their ELCs and provided performances well in excess of their cap-hit.
As the Blue Jackets take the next step into contention, the performance of Kent Johnson, the until-recent centerpiece of the Blue Jackets forward prospect corps, will be paramount. Does Kent Johnson belong in this previous cohort? Said differently, should the Blue Jackets be looking sign Kent Johnson long-term this offseason in a copycat style of Jack Hughes and Tim Stützle?
Creating a Cohort
Kent Johnson scored 40 points in 79 games this past season with the Columbus Blue Jackets in what was his second year post-draft (D2). Let’s go ahead and take a look at how that compares with recent performances in the NHL.
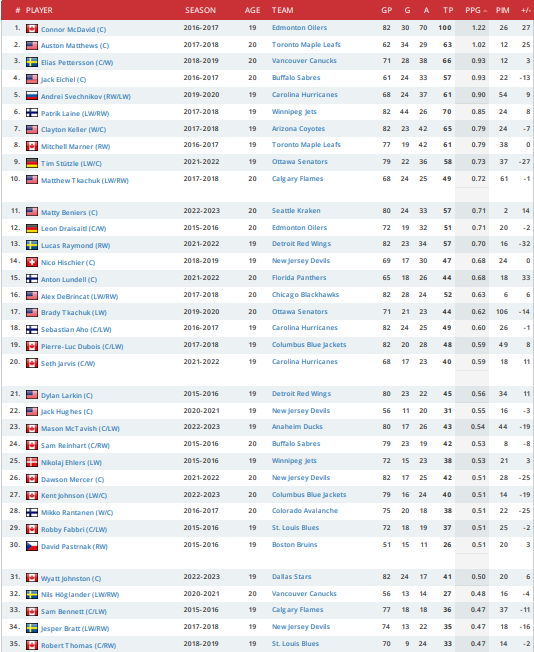
Kent Johnson grades out pretty well on a points per game basis. He isn’t quite at the level of very high performing high-draft picks, but he’s surrounded by very good NHL players.
The worst of the bunch are Robby Fabbri, who’s had injuries derail his career, Nils Hoglander, who hasn’t quite captured his performance and has been lost under new coaching in Vancouver, and Sam Bennett, who couldn’t find his way in Calgary but has recently broken out in Florida as a tenacious forechecker.
However, none of these three performed quite as well as Kent Johnson did, so we have plenty of reason to be optimistic.
Now, we’ll take a selection of these players and attempt to dive deeper into the numbers and see if there’s any data we can find that could either predict a breakout or raise any red flags about future performance.
RAPM
Here, we’ll use Regularized Adjusted Plus Minus from EvolvingHockey.com. This stat attempts to take account of deployment, teammates, minutes and competition and churn out individual player impacts across Goals, Expected Goals and Corsi impact both for and against.
Each of these is measured in per 60 minute rates as a way to determine performance rather than totals. It’s important to note that playing time, as well as total points, will certainly weigh into a contract discussion, but more on that later.
For brevity and clarity, I’ll use goal differential per 60 and shot differential per 60, because: according to Jack Han, “Shot differentials today is goal differentials tomorrow”. Please pardon the hasty Google Sheets graphs.
For the most part, I am including playmaking W/C hybrids, though Hughes, Stützle, Zegras and Thomas appear to have made permanent homes in the middle of the ice. Reinhart, Rantanen and Nylander have all dabbled at Center but generally remain wingers.
You may notice, I took some liberty and included some particularly impactful wingers who took until D+3 to make an impact, namely Nikita Kucherov and Matt Boldy. Nylander and Zegras played games in D+2, but not enough to meet the initial Points per Game cutoffs and weren’t a part of the EliteProspects chart.

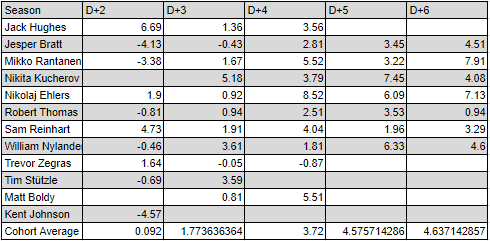
First, we’ll look at the data in chart form so we can reference some specific numbers. This chart is reviewing the on-ice goal differential, after being adjusted for teammates, ice-time etc. Notably, Kent Johnson is around middle of the pack.

Apologies to any colorblind folks, this may be a bit of a mess. I attempted to use symbols to make this a bit more clear but we can still use general trends to draw some conclusions despite the noise. I’ve overlayed the Cohort Average so that we can get an idea of the general trend despite individual performance variation.
As we can see, this cohort improved at creating a goal differential through their D+6 season. We can, and should, expect Kent Johnson to follow this general trend. In this case, he was in the upper half of this pack in terms of creating a goal differential.
Here, we can see where Kent Johnson struggled. While his goal differential was middle of the pack, he was the bottom player in terms of creating a shot differential. Fortunately, he wasn’t alone. Jesper Bratt and Mikko Rantanen, also playing as wings for terrible teams at the time, posted similarly bad shot differential numbers.
In that same vein, we can also see why the New Jersey Devils were so confident that Jack Hughes was worthy of being signed to a long term extension despite his otherwise meagre production. He was dominant in creating a Corsi differential and his points came to reflect that as soon as his S% rebounded (adding Andrew Brunette certainly didn’t hurt either).
This can serve as a reminder that RAPM is attempting to strip away linemate and deployment context, but I think you would be correct to remain skeptical that it can do that perfectly.
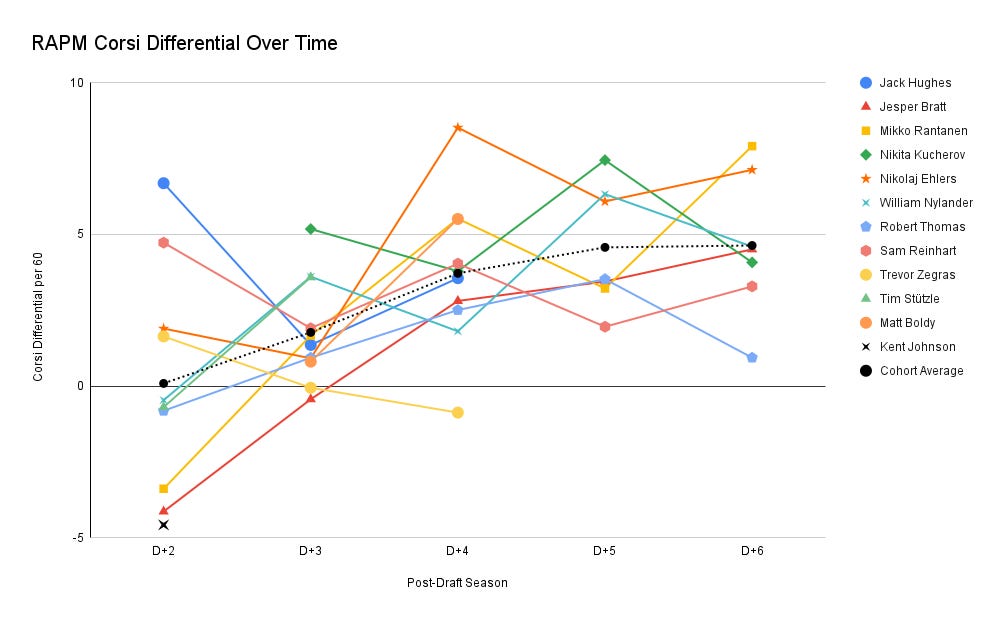
The good news is that all of the players in this cohort, with the exception of Trevor Zegras, showed remarkable improvement from D+2 to D+5 and grade out as very good players in this regard.
None of these really feel like monumental or earth shattering conclusions. Players generally get better over time and they generally show a shot-differential improvement a bit earlier than a goal-differential improvement. Kent Johnson, at least in terms of his point production, finds himself in very good company.
Differentiation
Still, I believe Stützle’s and Hughes’ performances put them in a tier separated from Kent Johnson, at least given the data we have up to this point. Unlike Kent Johnson, both played in the NHL in their D+1 seasons. Furthermore, both had a full season in at center-ice.
Stützle put up nearly 60 points in his D+2 whereas Jack Hughes had posted seasons with dominant Corsi-differentials (while posting shooting percentages of 5.7% and 7.7% in all-situations). In Hughes’ D+2, 2020-2021, he controlled 56.7 CF% at even strength on a team that finished 3rd to last in the NHL. Kent Johnson, for reference, posted at 46.2 CF% this past season.
Jack Hughes is nearly unparalleled (MacKinnon, McDavid being his peers in this regard) in his ability to carry the puck and create offense, as of most recently, has certainly turned that into superstardom. Even in his D+2, we could see this dominance from him. We’ve explained some of his past results, especially in regards to shooting percentage, but these microstats also explain why he was such an obvious bet to anyone who was paying attention.

Tim Stützle’s underlying stats didn’t quite scream superstardom in the way Jack Hughes’ did. Still, a 60 point pace season coupled with complete transition (both exiting and entering the zone) success made for a solid bet. Stutzle was already an above average creator of offense.
Additionally, both of Hughes and Stützle have top of the NHL skating, making their projection a bit more secure. These attributes, coupled with their extreme green flag performances under-the-hood or on the stat sheet, made them into extremely reliable bets to outpace their big dollar, long term extensions.
We can decide, with reasonable confidence, that Kent Johnson is not in the same tier as Jack Hughes and Tim Stutzle and should not be viewed as a slam-dunk 100 center.
Because of Kent Johnson’s first year of his ELC being burned, the Blue Jackets will have a year less data with which to make a judgement on his worth and future. He will be a 10.2c RFA and will have no leverage in terms of negotiating a new contract.
For these reasons, along with Jarmo Kekalainen’s comments after the draft, I believe Kent Johnson will not sign a contract this off-season, but this next year of data could prove instrumental for a variety of reasons.
Going Forward
Instead of attempting to project the degree of risk the Blue Jackets might take by singing a long-contract now, let’s instead look for “green flags” in Kent Johnson’s performance that might indicate he’s a wagon worth hitching to.
We’ve explored the data and found that Kent Johnson had the worst RAPM Corsi differential of the medium-high producing D+2 cohort. The two forwards who posted similar degrees of Corsi differential underperformance were Mikko Rantanen and Jesper Bratt.
Both of these players have developed into top of the lineup players. Rantanen signed a $9.25 million x 6 years deal after his ELC had expired. Jesper Bratt was bridged for $2.75 million x 2 years, signed a 1 year for $5.45 million and now has signed long term for $7.875 million.
While Matt Boldy didn’t have an eligible D+2 performance, I am going to include him in this next comparison cohort because he was, similarly, a wing on a wing-driven team who had competitive aspirations. He signed a $7million AAV for 7 years on an extension during the last year of his ELC (he produced 39 points in 47 games the year before, his D+3).
Now, we’ll use these players, and their improvements from their Draft +2 to their Draft + 3 seasons as benchmarks for evaluating Kent Johnson’s development. If Kent Johnson can mimic their improvements, we’ll have a good idea that he’s ready for a long term contract.
Under the Hood
To analyze further, specifically to find potential development pathways, we’ll need to look at more of the “how” in terms of production instead of the “what” that are shot and goal differential metrics.
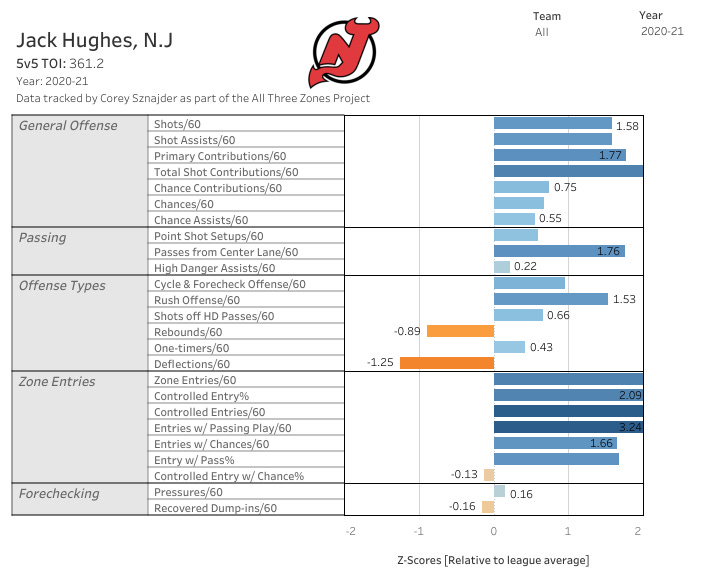
Here, we’ll use data from AllThreeZones.com, which is all hand-tracked by Corey Sznajder. It’s important to note that, unlike RAPM, these data is not cleaned or otherwise altered based on teammates, competition, deployment, etc. These are simply events that were observed in game and as such are very much impacted by teammates and competition.

Right away, we can see why Kent Johnson may have struggled to generate a shot differential at even-strength. He simply did not take or create shots at an NHL level. While that might sound a bit like repeating myself, it’s important to note that he was able to carry the puck very well and therefore get the puck into the situations where offense is most often created from.
The issue, then, remains his efficiency with in-zone offense. We can see that sort of decline bear out throughout his transition numbers as well. This isn’t necessarily a bad sign, as creating entries that lead to chances is much harder than simply creating entries.
This is a player who does all the right things but hasn’t figured out exactly how to create offense from the favorable positions that he does create.
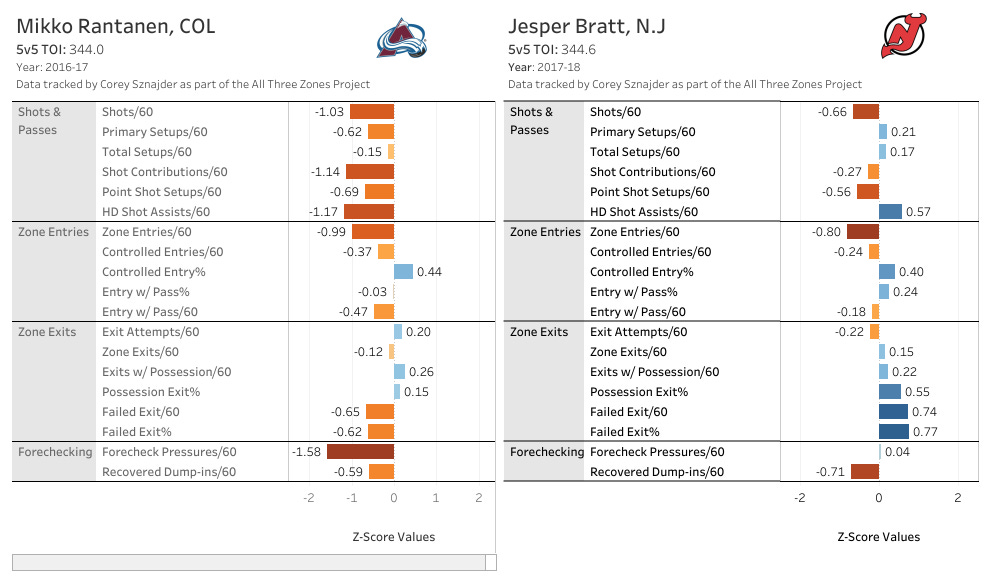
Although the data tracked is formatted slightly differently, we can see that Kent Johnson grades out favorably to both Mikko Rantanen and Jesper Bratt in their Draft Year + 2 seasons. While Bratt was a bit of a better playmaker off-the-jump, Johnson has them both soundly beat in transition offense.
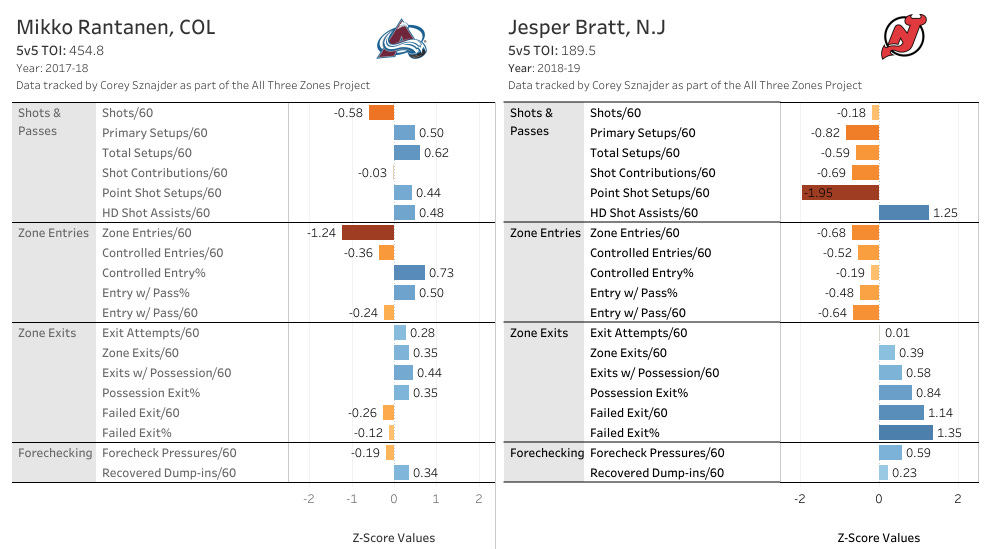
In their Draft Year + 3 seasons, we can see that both made improvements to their strengths and weaknesses. Rantanen made a rather large leap in terms of in-zone playmaking while Bratt regressed in terms of transition and became a quality over quantity playmaker.

Boldy, in his Draft Year + 3 season, grades out most similarly to Kent Johnson’s D+2 in terms of transition game and overall profile. He was a bit more secure in breaking out of his own zone but he was also surrounded by a competent D corps.
Deployment and Partnership
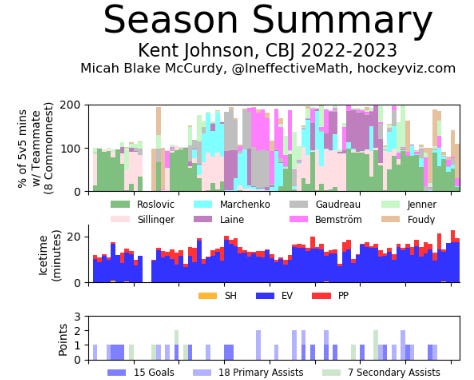
From Kent Johnson’s season summary, we can see that he had quite a chaotic deployment. For the most part, Johnson played with Jack Roslovic and Cole Sillinger. Neither of these two players are particularly stable and neither are particularly prolific in the offensive zone.
It’s too much of a stretch to say that Kent Johnson simply didn’t have good enough linemates but it could be that his lack of volume production was a symptom rather than a cause. If too many linemates aren’t good enough at making high percentage simple plays, Kent Johnson certainly being one of them, it can be hard for any of them to get a grasp.


Mikko Rantanen has been stapled to Nathan MacKinnon since his D+2. For the most part, their ascension to the top of the league came from their chemistry together as a dominant top-line with Gabe Landeskog after their miserable 2016-17 season and the Matt Duchene trade.
Here, we can see that Rantanen and MacKinnon’s chemistry was a primary force in Rantanen’s Draft + 3 leap in production and offense creation. MacKinnon had a primary assist on more than half of Rantanen’s goals.
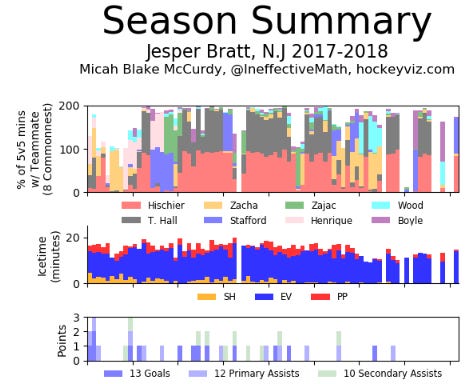

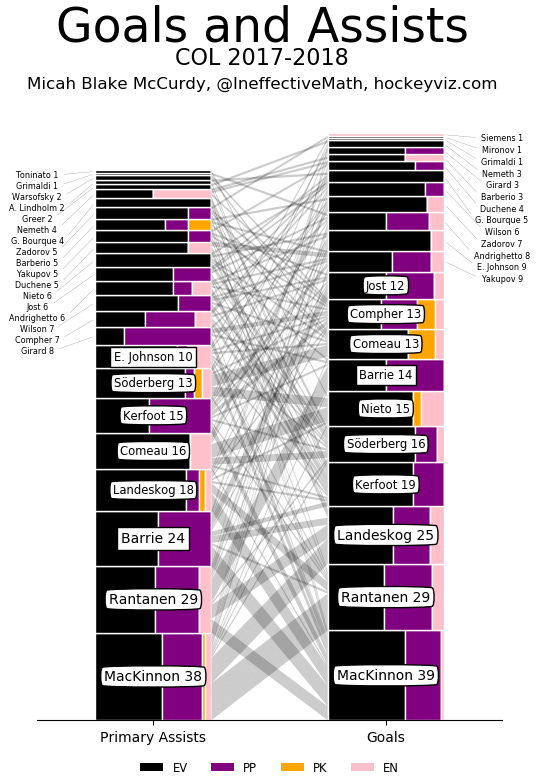
Jesper Bratt’s linemates look a little closer to Kent Johnson’s at first glance. While he has shared a large part of that time with Nico Hischier, he also shared quite a bit of ice-time with the unable-to-breakout Pavel Zacha. His other common wingers were Taylor Hall and Kyle Palmieri, two established veterans with decent skill.

Here, we can see that Bratt didn’t have any specific chemsitry established between his most common linemates. He did assist on Zacha and Hall goals, but the totals are very low. It took him until 2021-2022 to fully breakout and become a star.

While we can see that Bratt has never relied upon a single player in the way Mikko Rantanen has, he did form a much better production pipeline between himself and both Jack Hughes and Nico Hischier.

Matt Boldy, similarly landed in the NHL with a readymade linemate. He had instant chemistry with Kevin Fiala who was a talented play driver and playmaker in his own right.

Although Boldy’s information is harder to see (he only had a partial season and this is a full season infographic), we can see common pipelines between him and Kevin Fiala, who played a large part in a lot of the offense that Boldy produced in his rookie season.
Special Teams
You may have noticed the large purple bars in a few of those goals and assists displays from HockeyViz. Top of the league producers of offense also get it done on special teams. You don’t become a point-per-game player at 5v5.
Now, we’ll take a look at the rate production from the cohort on the powerplay. This will make it easier to understand their performance at a glance without having to mentally weight differences in total minutes.
Most of these players produced well on the powerplay but none created more than Mikko Rantanen. In his second season, he was one of the best powerplay creators in the NHL. It is no coincidence that this performance, along with his 300 powerplay minutes, coincided with his emergence has an above point-per-game player and very highly paid superstar.
Here, I’ve included an extra season from Jesper Bratt for a specific reason. His performance and increased minutes also coincided with his breakout as a point-per-game player (and thus, a player deserving of a long-term high-money deal).
Matt Boldy has had a mix of both opportunity and performance during his time with the Wild. He hasn’t broken out as a top performer yet but struggled at 5v5 until the Wild added Marcus Johansson at the deadline. Removing his partner-in-crime Kevin Fiala came at a cost to Boldy’s performance.
Kent Johnson’s Green Flags
If we take some time to look back and review the data for patterns, we can see a similar profile in terms of zone-entries as they relate to total offense.
Kent Johnson, Tim Stützle and Matt Boldy all had the same general shape to their Zone Entry data, Controlled Entry w/ Chance % being below average but the rest pretty firmly above. Stützle and Boldy, however, had increased actual offense generation and that might be an explanation for their Points per Game results being 0.72 and 0.83, respectively, in contrast to Kent Johnson’s 0.51.
From this data, we can conclude that if Kent Johnson wants a long-term contract, we’ll need to see him ascend to an above average creator of shots and chances while building on his transition game.
Similarly, it’s possible that their observed offense microstats also have an explanation.
As we saw from the data of Boldy and Rantanen, playmaking wingers need a partner who can create. If 2022-2023 is anything to go by, Cole Sillinger wasn’t exactly it. Adding Adam Fantilli, or examining a pairing of Kent Johnson and Patrik Laine, could yield the results necessary for improved performance.
Kent Johnson’s first performances on the powerplay in Columbus show some promise. He produced at a rate commensurate with his peers but not one that suggests the dominance of Mikko Rantanen (though his D+2 season was worse). If Kent Johnson can have a similar glow-up, we could very well be seeing the next NHL superstar.
The problem with this picture, at least at this point, is that Johnny Gaudreau is currently stationed in the spot Kent Johnson would most likely, and most recently did, occupy. He’s certainly not going to replace Patrik Laine on the left half-wall. There’s room for some more creative deployment, especially at net-front, where Kent Johnson can unleash his full bag of tricks in tight-spaces, but currently Boone Jenner occupies that slot and his FO% is important to getting powerplays off on the right foot.
Still, Johnny Gaudreau, in his most dominant seasons, has done a significant portion of his damage at even-strength and Kent Johnson’s manipulation and creativity should certainly be a weapon.
In summation, here are Kent Johnson’s green flags:
RAPM Corsi Differential ascending to NHL average
Established Chemistry with a Talented Forward
A spot on PP1
If Kent Johnson is meeting these metrics, it would be wise for the Blue Jackets to offer an early extension. Jack Hughes signed his contract in November 2021, Tim Stutzle signed his in September 2022.
Similarly, if the Blue Jackets don’t see growth or chemistry from Kent Johnson, it could mean he’s following Jesper Bratt’s longer development path and a short bridge could be the best way for the Blue Jackets to be competitive now without mortgaging their cap future.
Future Considerations
While Kent Johnson, and his next contract, firmly relies upon his development and how he translates that into on-ice performance, it would be foolish to ignore the other dynamics at play.
Rising Cap
This may be the last off-season where deals can be signed based on the market that was created during the flat cap years. The offseason trade market has completely frozen as teams struggle under the weight of their cap hits and free agents are signing short term deals.
GMs, similarly, may now attempt to sign long-term contracts that take into account a general increase in cap-ceiling. Bridge contracts are going to be of special risk and cirumstance on this occasion.
If Kent Johnson signed a $7 million x 7 year extension today, that would be 8.3% of the cap hit. If he signs a 2 year extension, similar to Jesper Bratt, and the cap goes up by the amount currently projected on CapFriendly.com (to $92 million by 2025-2026), a similar Cap% deal would be $7.82 million per year.
While $800,000 extra may only get you an NHL minimum forward, considering the current roster dynamics of the Blue Jackets, those dollars might be important. If Adam Fantilli performs to the level of Jack Eichel, you’re happy to pay, but that would come around a Cap% of 12%, or $11 million in 2026-2027 dollars. Does Jarmo Kekalainen, or even the next GM, want to sign both of those contracts in the same off-season?
Impending Comparables
Much of this deliberation and speculation may ultimately be unimportant. There are a few players in the D+2 cohort that are likely to sign contracts before Kent Johnson signs his deal. Seth Jarvis, Dawson Mercer and Trevor Zegras were all drafted prior to Kent Johnson, all produced at a similar rate in their D+2 and similarly profile as C/W forwards.

Seth Jarvis and Dawson Mercer profile as play-driving but complementary to a stable of stars whereas Zegras is a focal point of his team. How Kent Johnson fits in that mix will be very much up to his performance this coming year.
As their teams sign them to contracts, we may see Kent Johnson’s agent ask for a deal of comparable value. As a Blue Jackets fan, pay close attention to those negotiations and their respective deals. It could give us clues as to the bridge vs term strategy and they could set the new market-value as the cap begins to rise.