
Applying Rudimentary Adjustments to the Expected Goals Model
Evalutating the Team, Players under this new Lens

Given that Adam Fantilli is still not signed, Kirill Marchenko rumors swirl, I feel somewhat stuck in a permanent “waiting mode” with regards to putting the final bows on this off-season. I intended to be more or less done with the tracking project and trying to learn things as applied directly, aside from perhaps building the expected goals model from pure passing information otherwise. Whether or not that happens I’m not clear but suffice to say I did get the “bug” in me relative to seeing how incorporating blocks and passing and situation adjustments would impact our conclusions about how the team performed this past season. As we’ll see, it’s perhaps not as much as you would think.
Incorporating Blocks
The NHL does not like to give us information location on the shot location but rather the location at which the shot was blocked. This offers no tangible analysis benefit that I can think of. If you believe that a shot, despite being blocked, should be considered a chance based on where it was taken, then you’ll like where we get to go next. My shot tracking has enabled at least a general estimate of locations.
The process here is rather simple. Shots bins were created based on NHL Edge’s shot for no real reason other than I hoped they had some logic about making theirs. In any case, I know from previous work how many shots were of each type of outcome: blocked, missed, on-goal (saved) and scored.
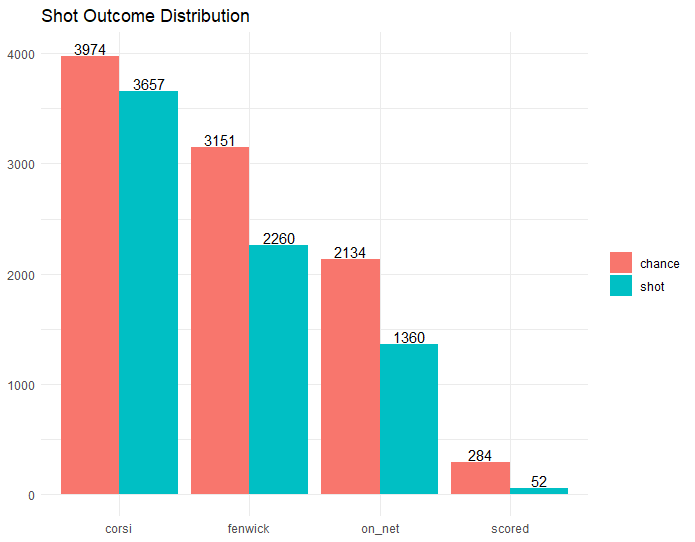
This is a rudimentary visualization of the concept. Rather than creating “large” bins like chance and shot, I discovered the distribution for each location bin. What was most important was the ratio of corsi to fenwick as that captures the difference between what a traditional expected goals model sees and what extra information we have from tracking.
Any expected goals model assigns a “predicted goal” value for any given shot. We can also think of that value differently by describing it as “predicted fenwick shooting percentage” - the likelihood that this unblocked shot was scored (and there by not missed and not saved along the way). In order to incorporate extra information, we’ll need to estimate the “predicted corsi shooting percentage” of any given shot. Essentially, we use the observed probability of each shooting bin to apply an adjustment to the “predicted fenwick shooting percentage”.
Specifically, we do not incorporate any other situation based information as we’ll be applying those later and we don’t want to double-count some of our already dubious post-fact adjustments to the model. From here on, I’ll call this blocks-incorporated adjustment of the EH model cxG. If you don’t like new acronyms, you’re not going to like where this is going.
Adjusting Scoring Probability for Pre-Shot Movement
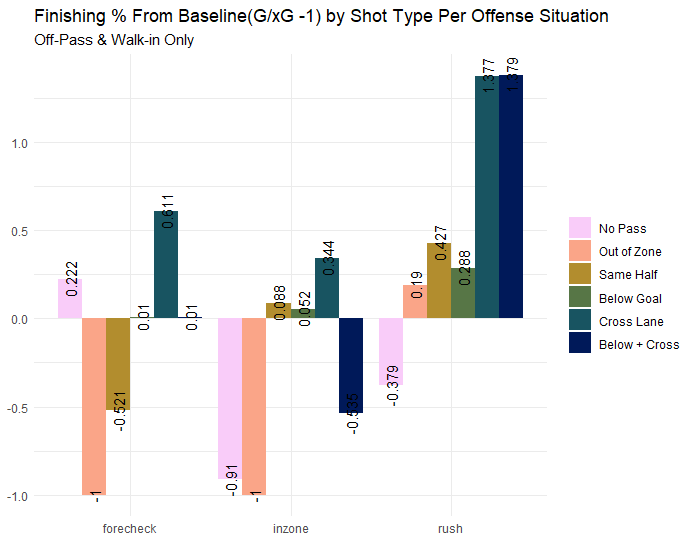
With blocks incorporated, the value of certain passes and situations looks a bit different. A big chunk of the value of rush shots is indeed that they do not get blocked. A big issue with the proportional scoring of forecheck shots was that plenty were blocked or missed but that they scored very well if they weren’t.
In any case, the same bigger trend holds: cross-lane passes are king but it does somewhat undermine the value of below-goal line passes. Though the above is providing some information about the value of passes and situation, the baseline xG value has incorporated blocks.
None of these specifics are particularly important at the moment because we will be applying the observed finishing differences back to the now estimated cxG. In order to calculate the full adjustment profile, I took three factors: shot type (off-pass, walk-in, tip, etc), offense-situation (rush, forecheck, inzone) and distilled them all down to examine corsi shooting % and predicted corsi shooting % and then (or G vs xcG) then creating a single finishing adjustment number from there.
We have a litany of statistical issues coming from this practice but it’s the best we have of extremely limited data. First, some of these specific situations have very small samples and therefore either no goals or very high “finishing” values because of a goal out of like three shots. In any case, we can only play with the cards were dealt. If any situations had no goals, and therefore a finishing of 0, we simply excluded their adjustment value.
The second, and bigger, issue is that we’re applying the adjustment to the data from which the adjustment was created. It would be fine “adjustment” to apply if we had a bigger sample from not specifically these shots but, again, we don’t have those. As such, we must live with the fact that we are simply pulling an expected goals model closer toward what we observed and then re-evaluating the same predictions from the past.
The good thing is that we’re not using this to evaluate the validity of a new model we are simply “seeing what we see”. Conceptually, this data could be used to better predict shots next season, or maybe I could apply more stable adjustments and do a sort of split-half sample, but this will suffice for now.
Once we have the “finishing” adjustments, I will then multiply the individual cxG value for each given shot by said finishing adjustment. This will then give us the passing and situation adjusted predicted scoring value, know now as the pasa-cxG.
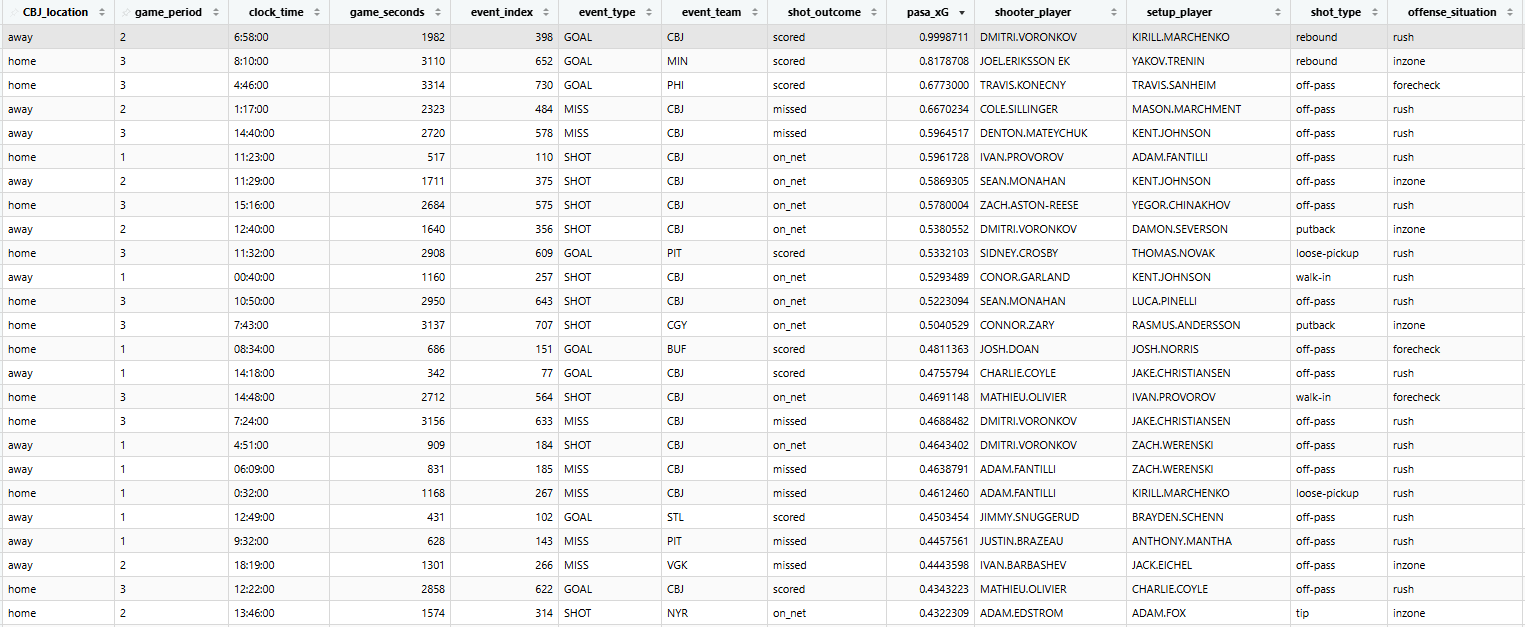
In case you were wondering, here are the top 25 pasa-cxG values on the season, topping out at a whopping 0.9987 rebound by Dmitri Voronkov, assisted by Kirill Marchenko while playing the Vancouver Canucks.
You’ll notice the location of the shot, specifically in the crease, which were never recorded as being blocked, perhaps for obvious reasons, which plays a pretty significant part in terms of valuation. Similarly, in-crease shot locations are somewhat new and perhaps inappropriately captured by Evolving-Hockey’s trained-on-human model. In any case, a “shot” taken nearly behind the goaltender has a pretty good chance of being a goal.
The general values are somewhat nice to see. Though this one is absurd, no values ever exceeded 1 which is impossible from an probability perspective but didn’t have any guardrails to prevent it from happening based on the way I applied the transformations.
Examining Team Play Through Stretches
The perhaps highest level view we could take with our pre-shot incorporated model would be in examining how the Blue Jackets performed, in general, relative to their competition. Given that everything above has been generated with data taken from 5v5, we can now simply examine how the team performed in each instance.
Given that I took a look into how the team performed across stretches, I think that’s a good place to look. Apologies for not putting more effort into some sort of tables or visualizations but screenshots of the R output will just have to do.
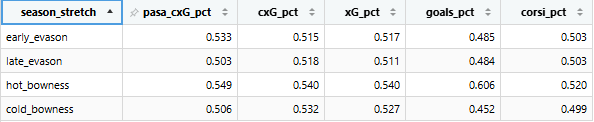
In each stretch, we have a variety of metrics across the adjustments. xG is simply EH’s xGF% at 5v5, cxG is the same but has blocks incorporated and pasa_cxG is the full extent.
What’s interesting to notice, perhaps, is that the early evasons stretch (pre-Thanksgiving) had the Blue Jackets looking quite good. A 2.15 % difference based purely on passing and situation improvements feels considerable. Remember, this isn’t just CBJ offense being adjusted but the opposition getting the adjustments as well.
Whatever happened during this beginning stretch (I’m guessing it might have a lot to do with Kirill Marchenko being at the height of his rush dominant powers) the Blue Jackets controlled the pre-shot environment extremely well.
Based on other metrics, Dean Evason’s tenure wasn’t altogether that much different at 5v5. Perhaps if there were certain “score adjusted” metrics we would also see some “boosting” by way of the Blue Jackets very often playing with a lead (before crashing and losing). Either way, though they were the better team the goals never came and the erosion of whatever early-season systems promoted his team left.
Though Bowness had dramatically better raw xG counts and totals, each different stretch shows a different side. The cold stretch under him was much worse across all facets than the comparatively worse Evason stretch. Once we adjust everything, they’re very nearly the same. This complete drop in adjusted performance might suggest that Bowness had the team playing in a way that “xG hacked” rather than creating the type of environments that promote “true quality”. These are unverifiable claims, unfortunately, as it’s not clear that the adjusted are any closer to “actual goals” given the strangeness of each stretch.
The hot stretch has it’s own sort of issues, the Blue Jackets playing a great degree of bad teams during it, but it clearly stands alone as better in literally every way. The Blue Jackets must be careful not to think this is a “more true” representation of their club or else be forced to prove it under more difficult circumstances next season.
Of course, this doesn’t really tell us that much about how the Blue Jackets stand relative to the league. While it’s nice that in approximately half of the season they outperformed their raw xG environment, it’s not clear how that would play relative to the rest of the league over the whole season.
Players On-Ice Performance
The next step, of course, would be to examine how individual players performed across some of the same metrics. The good news is that these visualizations are easier because we no longer have to consider each separate category as worth visualizing! Unfortunately, this also means the more interesting color palettes are not on display.
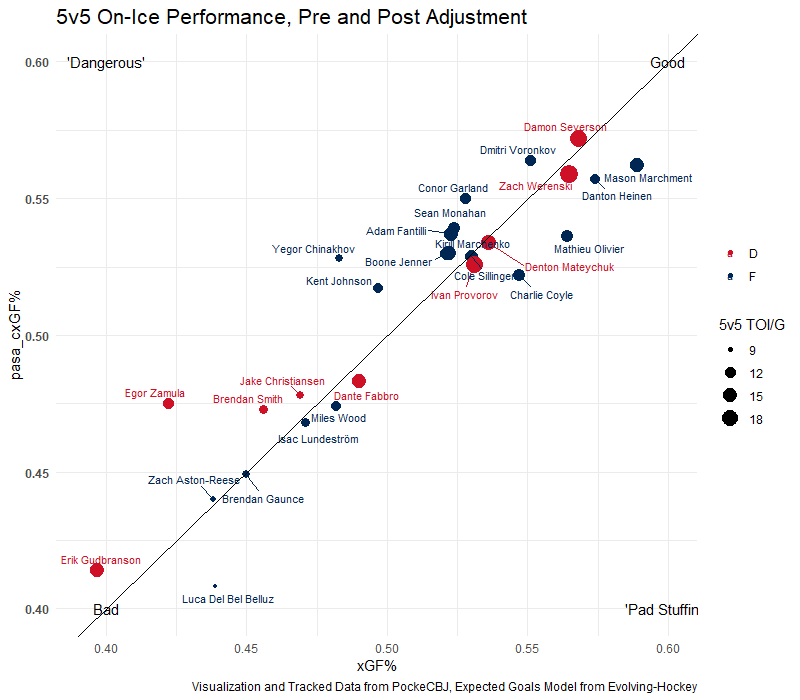
The x-axis is Evolving-Hockey’s standard xG model share and the y-axis is made with all of the adjustments.
A couple of things to note.
First, while there’s a sort of continuous distribution along the expected goals axis, there’s a distinct trough between the top nine and top four and the bottom pairings and lines on the vertical axis. What to make of this? I can’t really say. I could see two plausible explanations: the bottom of the roster was dead weight or the bottom of the roster was asked to play an entirely different style.
I think, often, certain types of coaches as their fourth lines to be “sin eaters”. That is to say, take hard minutes that we know for sure they will lose but hopefully it frees up better situations for players who are skilled enough to utilize those new situations. This criteria might have some legs as the “matchup line” an all accounts high performing line, also suffered from some pre-shot struggles. Perhaps that’s simply an artifact of playing more minutes against top competition. That doesn’t exactly explain Heinen or Marchment.
Secondly, defensemen appear to have limited impact on pre-shot information. This might have something to do with minutes played or being deployed with a diversity of players but each of them is quite distinctly near the middle line.
The last observation is that, based on what we’ve seen, Chinakhov, Johnson and Voronkov all deserved better results at 5v5. Perhaps not Voronkov who had nothing but completely sterling metrics across the board, but each of them had evidently a quite positive impact on creating non-measured danger.
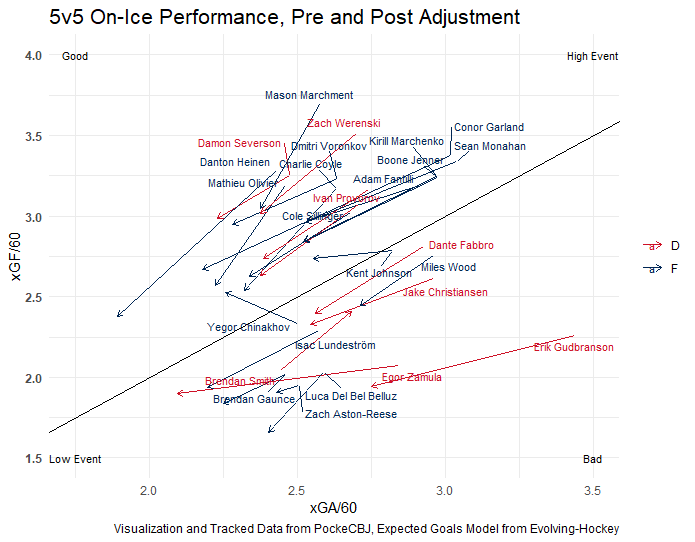
Apologies for this…. bee’s nest of a plot. Including this much information is unkind to visualization.
Essentially, this is the change in a players’ on-ice xG numbers, for and against, before and after the adjustments. The lines come from EH xG rate values and the arrow points toward the pasa_cxG adjusted values.
What we are observing, essentially, is a partial correction of the xG model. The EH model had something like 70 goalies saving “above expected” which helps illustrate that there were probably too many “expected goals” being handed out. Thus, we observe a large shift toward “lower event”.
The slope of the lines is most important. There, we can see that Chinakhov and Kent Johnson had very nearly the most “positive” adjustments between the two metrics. Kent Johnson’s on-ice xGF/60 stayed even (which then makes him a generally quality offensive player) whereas Chinakhov’s was the only player who actually improved.
Not the cleanest data to work with here but if you’d like to spend a ton of time following the individual players, the information is there.
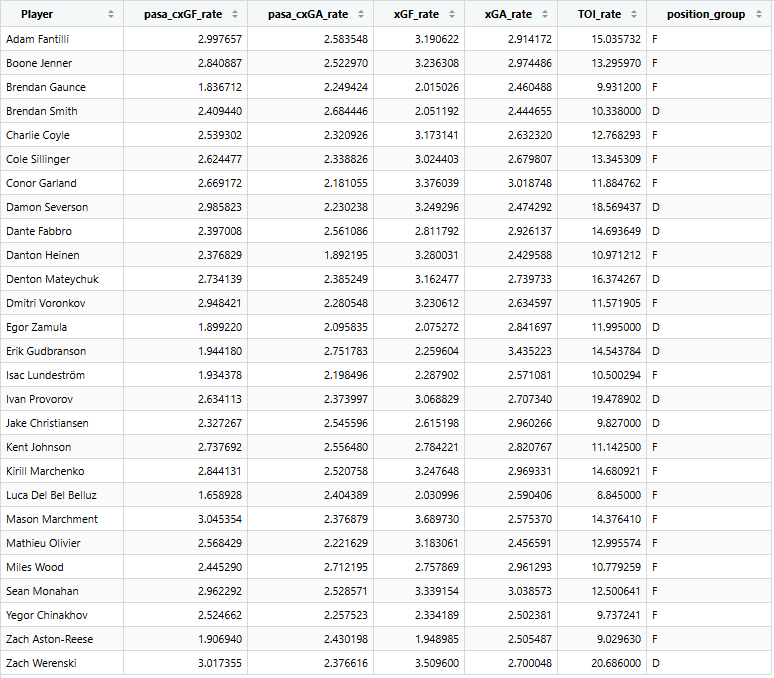
If you’d like the hard numbers with way too many decimal points, here they are.
Adjusting Player Contributions
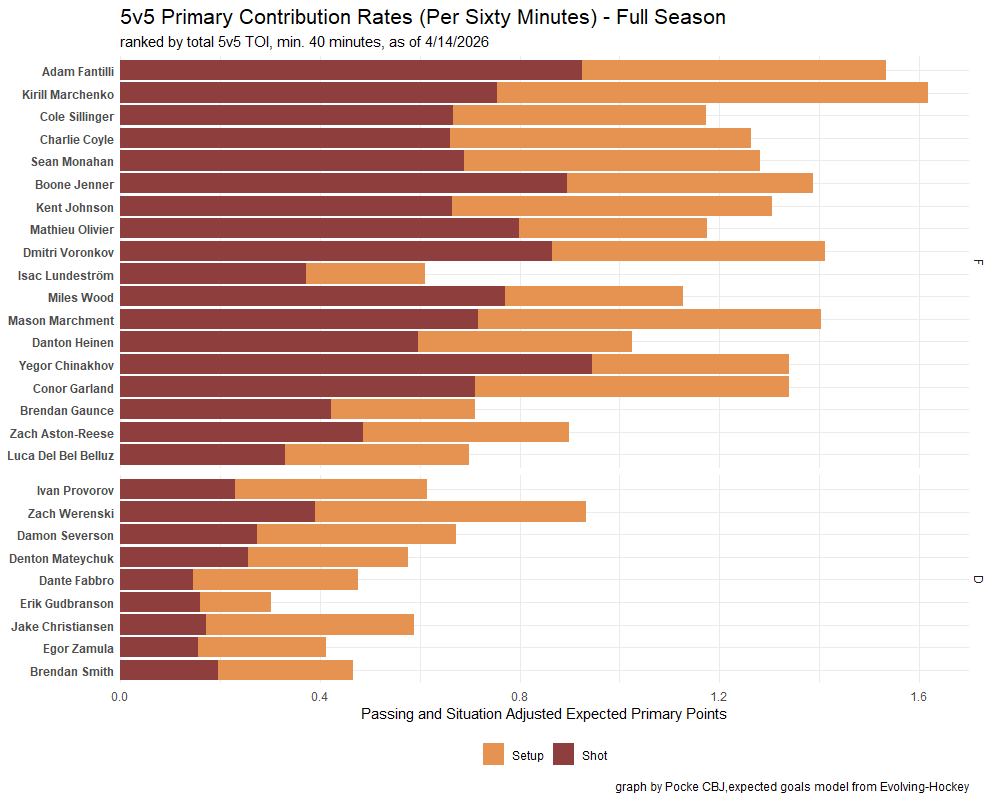
After accounting for all of the things we can account for, it appears that Adam Fantilli and Kirill Marchenko were, by far, the best actual creators of offense. Similarly, Voronkov and Marchment are quite nearly tied as the top of the next group with Jenner just behind. After that, the surprising inclusion of Kent Johnson, Yegor Chinakhov and Conor Garland.
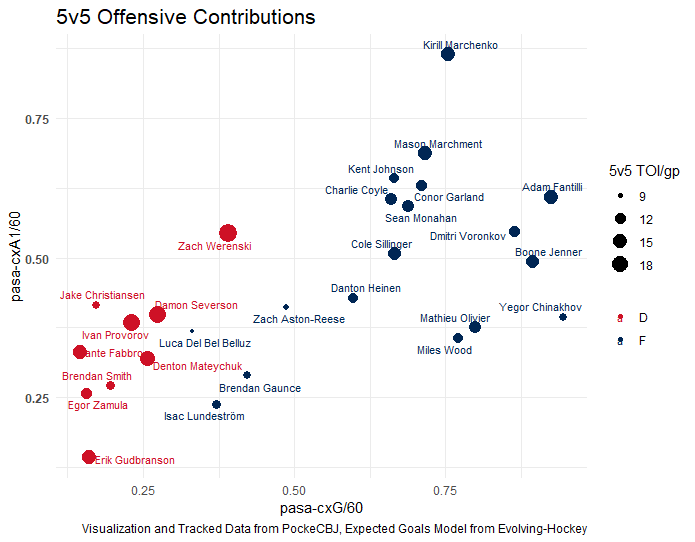
I will save us from another entirely chaotic plot but this can help us visualize the differences in shooting and passing better. Kirill Marchenko was far and away the best playmaker, Marchment after him, but Kent Johnson after him after accounting for situations and passing plays.
There is a cluster of players who “should have” performed more similarly but actually finished far more differently than even that. Coyle and Monahan, then, could have wildly different seasons next year. Perhaps this was the wildly different Monahan year, he was one of the top 5v5 rate scorers last season.
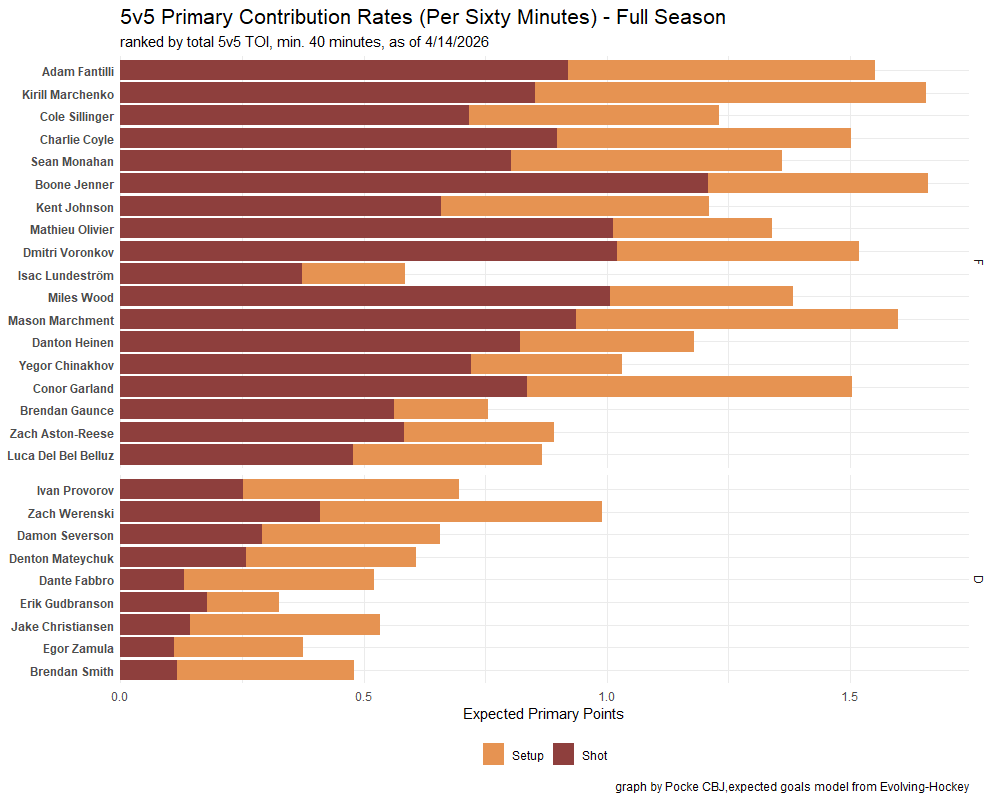
For reference, here is the Evolving-Hockey expected goals information which has Marhcenko and Fantilli more or less even with Boone Jenner and Mason Marchment and Kent Johnson below Coyle, Olivier and Sillinger.
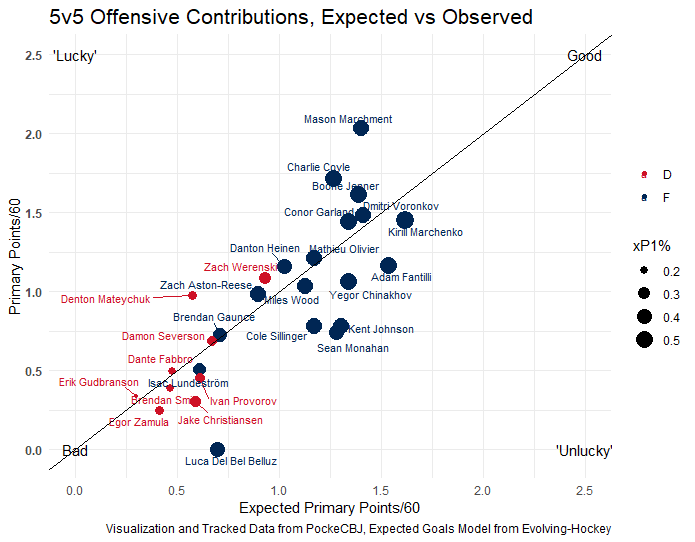
When plotting with respect to actual scoring I think we can see that the numbers have come back down to earth relative to some of the end-of-year graphs that featured before adjusting for blocked shots.
In this case, we still see many of the things we saw all season. Johnson and Monahan created good offense but absolutely under no circumstance scored. Mason Marchment and Charlie Coyle were good but mostly they scored.
The best creators of offense, Fantilli and Marchenko, didn’t score at 5v5 as well as they could have. Both posted low 5v5 points / 60 and both have the potential for significant positive scoring regression next season should you believe that Fantilli will be an NHL positive goalscorer.
Marchment is already gone, if Marchenko is heading that way too, the Blue Jackets will need some significant playmaking improvement. Dmitri Voronkov seemingly already possesses the on-ice offense impact, perhaps Kent Johnson or Conor Garland can make up the rest.
Awesome stuff as always Eric!
This is very cool! Great work!